19 Orchard Rd Sturbridge, MA 01566
Estimated Value: $555,000 - $578,000
About This Home
This home is located at 19 Orchard Rd, Sturbridge, MA 01566 and is currently estimated at $567,353, approximately $216 per square foot. 19 Orchard Rd is a home located in Worcester County with nearby schools including Burgess Elementary School, Tantasqua Regional Junior High School, and Tantasqua Regional High School.
Ownership History
We collect this data history from publicly available records. To have your information removed, we recommend requesting removal directly through your county’s website.
Purchase Details
Home Values in the Area
Average Home Value in this Area
Purchase History
We collect this data history from publicly available records. To have your information removed, we recommend requesting removal directly through your county’s website.
| Date | Buyer | Sale Price | Title Company |
|---|---|---|---|
| -- | -- |
Mortgage History
We collect this data history from publicly available records. To have your information removed, we recommend requesting removal directly through your county’s website.
| Date | Status | Borrower | Loan Amount |
|---|---|---|---|
| Open | $180,000 | ||
| Closed | $60,000 | ||
| Closed | $200,000 |
Tax History
We collect this data history from publicly available records. To have your information removed, we recommend requesting removal directly through your county’s website.
| Year | Tax Paid | Tax Assessment Tax Assessment Total Assessment is a certain percentage of the fair market value that is determined by local assessors to be the total taxable value of land and additions on the property. | Land | Improvement |
|---|---|---|---|---|
| 2025 | $7,659 | $480,800 | $104,900 | $375,900 |
| 2024 | $7,369 | $446,900 | $102,900 | $344,000 |
| 2023 | $6,961 | $385,200 | $88,900 | $296,300 |
| 2022 | $6,716 | $350,700 | $80,300 | $270,400 |
| 2021 | $6,195 | $325,700 | $76,400 | $249,300 |
| 2020 | $6,195 | $325,700 | $76,400 | $249,300 |
| 2019 | $5,923 | $309,300 | $78,700 | $230,600 |
| 2018 | $5,698 | $293,100 | $74,900 | $218,200 |
| 2017 | $5,430 | $279,900 | $72,100 | $207,800 |
| 2016 | $5,321 | $277,000 | $70,100 | $206,900 |
| 2015 | $5,249 | $272,800 | $70,100 | $202,700 |
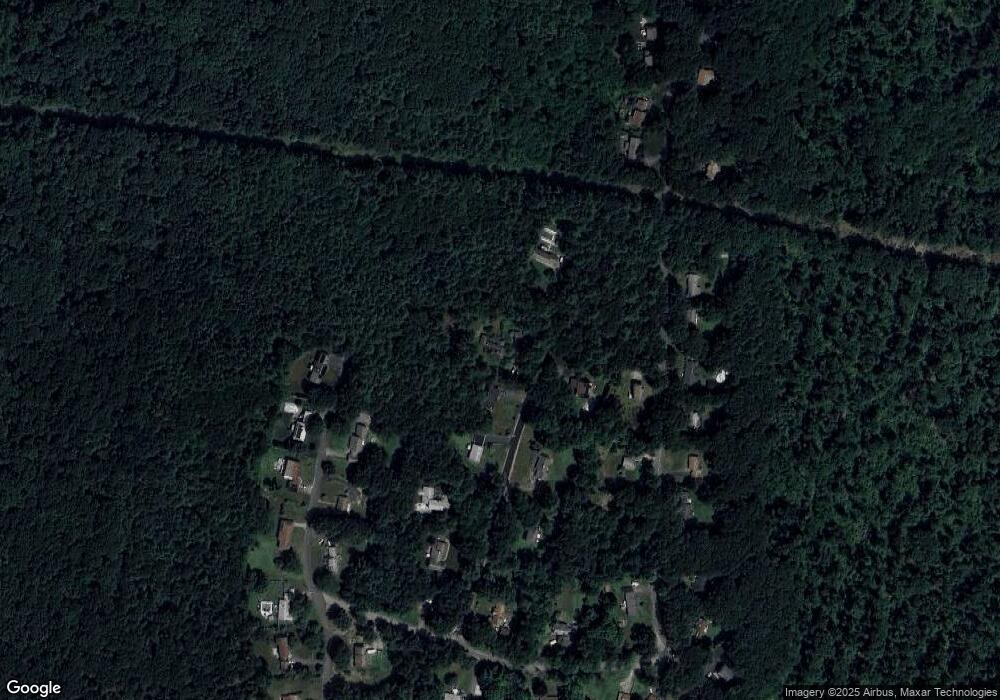
Map
Ask me questions while you tour the home.