19 Peckham St Unit 21 Rehoboth, MA 02769
Estimated Value: $653,607 - $762,000
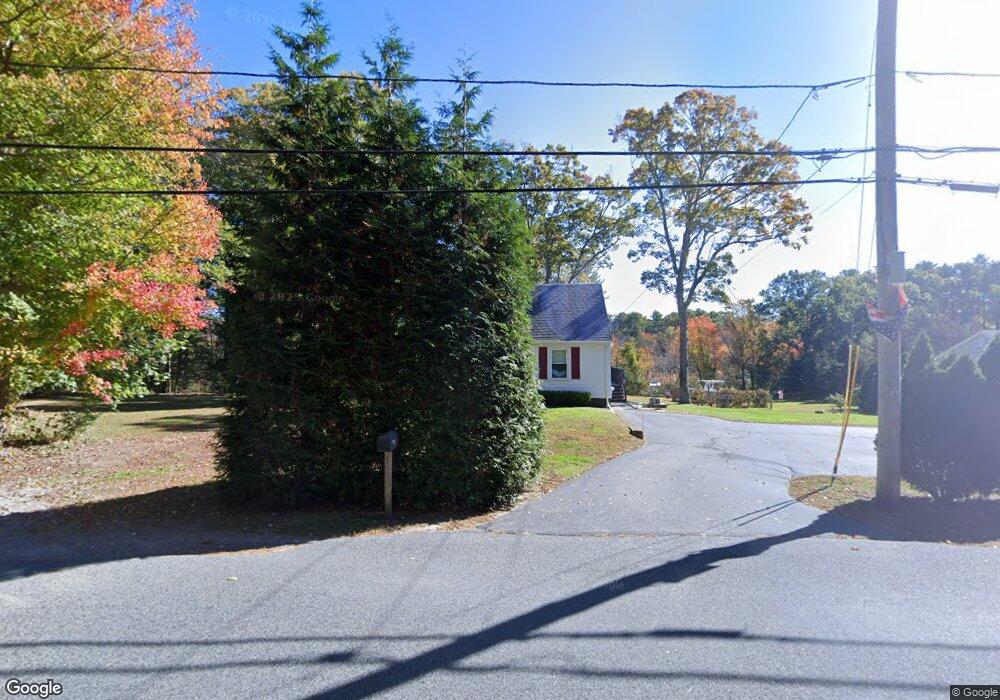
About This Home
This home is located at 19 Peckham St Unit 21, Rehoboth, MA 02769 and is currently estimated at $719,152. 19 Peckham St Unit 21 is a home located in Bristol County with nearby schools including Dighton-Rehoboth Regional High School and East Bay Career Academy.
Ownership History
We collect this data history from publicly available records. To have your information removed, we recommend requesting removal directly through your county’s website.
Purchase Details
Purchase Details
Purchase Details
Home Values in the Area
Average Home Value in this Area
Purchase History
We collect this data history from publicly available records. To have your information removed, we recommend requesting removal directly through your county’s website.
| Date | Buyer | Sale Price | Title Company |
|---|---|---|---|
| -- | None Available | ||
| -- | None Available | ||
| -- | -- |
Tax History
We collect this data history from publicly available records. To have your information removed, we recommend requesting removal directly through your county’s website.
| Year | Tax Paid | Tax Assessment Tax Assessment Total Assessment is a certain percentage of the fair market value that is determined by local assessors to be the total taxable value of land and additions on the property. | Land | Improvement |
|---|---|---|---|---|
| 2025 | $60 | $535,600 | $177,700 | $357,900 |
| 2024 | $5,675 | $499,600 | $212,300 | $287,300 |
| 2023 | $5,199 | $484,200 | $207,900 | $276,300 |
| 2022 | $5,199 | $410,300 | $191,000 | $219,300 |
| 2021 | $5,071 | $383,000 | $174,400 | $208,600 |
| 2020 | $4,980 | $379,600 | $182,400 | $197,200 |
| 2018 | $4,440 | $370,900 | $173,900 | $197,000 |
| 2017 | $4,214 | $335,500 | $173,900 | $161,600 |
| 2016 | $4,144 | $341,100 | $181,500 | $159,600 |
| 2015 | $4,094 | $332,600 | $173,300 | $159,300 |
| 2014 | $3,951 | $317,600 | $165,000 | $152,600 |
Map
- 205 Brook St
- 198 Brook St
- 205R Providence St Bldr Lot 4
- 207 Providence St Bldr Lot 2
- 3, 7, 11 Barney Ave Bldr Lot 7 8 9
- 18 Abbey Ln
- 0 Winter St
- 117 Brook St
- 129 Mason St
- 70 Wheaton Ave
- 151 Wheeler St
- 197 Chestnut St
- 67 Wheeler St
- 72 N Wheaton Ave
- 138 Chestnut St
- 151 Summer St
- 109 Cameron Way
- 111 Summer St
- 3a Johnnies Way
- 794 County St
Ask me questions while you tour the home.