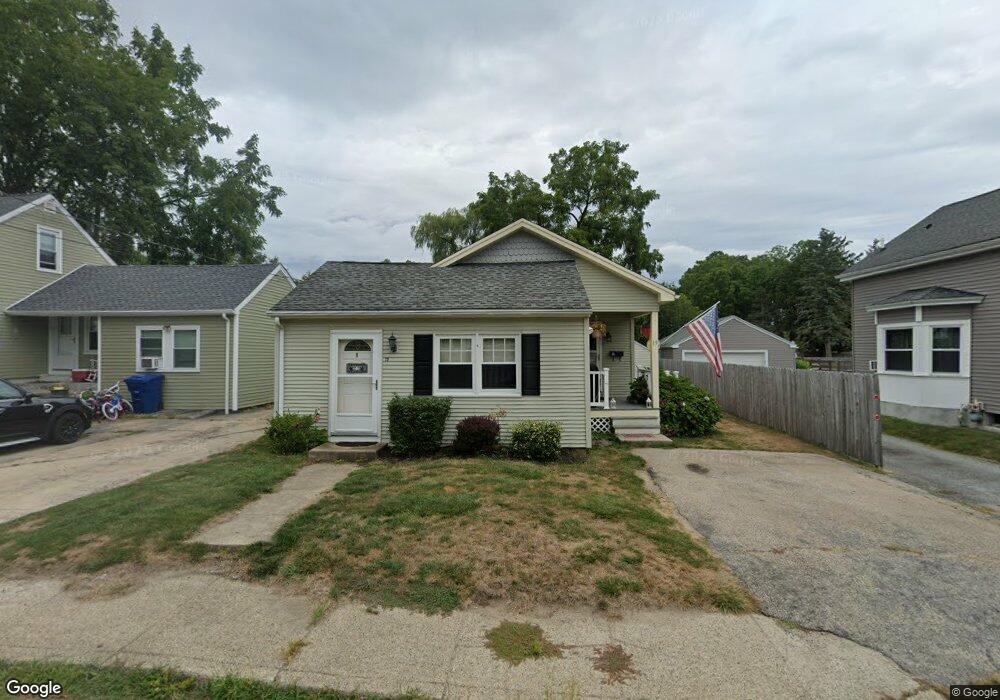
19 Rathbun St West Warwick, RI 02893
West Warwick Centre NeighborhoodEstimated Value: $315,000 - $345,000
2
Beds
1
Bath
932
Sq Ft
$351/Sq Ft
Est. Value
About This Home
This home is located at 19 Rathbun St, West Warwick, RI 02893 and is currently estimated at $327,327, approximately $351 per square foot. 19 Rathbun St is a home located in Kent County with nearby schools including West Warwick High School.
Ownership History
Date
Name
Owned For
Owner Type
Purchase Details
Closed on
Sep 23, 1991
Sold by
Lafond Robert
Bought by
Gould James
Current Estimated Value
Home Financials for this Owner
Home Financials are based on the most recent Mortgage that was taken out on this home.
Original Mortgage
$78,800
Interest Rate
9.17%
Create a Home Valuation Report for This Property
The Home Valuation Report is an in-depth analysis detailing your home's value as well as a comparison with similar homes in the area
Home Values in the Area
Average Home Value in this Area
Purchase History
| Date | Buyer | Sale Price | Title Company |
|---|---|---|---|
| Gould James | $83,000 | -- |
Source: Public Records
Mortgage History
| Date | Status | Borrower | Loan Amount |
|---|---|---|---|
| Open | Gould James | $10,000 | |
| Open | Gould James | $88,500 | |
| Closed | Gould James | $88,500 | |
| Closed | Gould James | $78,800 |
Source: Public Records
Tax History
| Year | Tax Paid | Tax Assessment Tax Assessment Total Assessment is a certain percentage of the fair market value that is determined by local assessors to be the total taxable value of land and additions on the property. | Land | Improvement |
|---|---|---|---|---|
| 2025 | $3,823 | $267,500 | $74,900 | $192,600 |
| 2024 | $3,566 | $190,800 | $47,600 | $143,200 |
| 2023 | $3,495 | $190,800 | $47,600 | $143,200 |
| 2022 | $3,442 | $190,800 | $47,600 | $143,200 |
| 2021 | $3,264 | $141,900 | $39,100 | $102,800 |
| 2020 | $3,264 | $141,900 | $39,100 | $102,800 |
| 2019 | $4,161 | $141,900 | $39,100 | $102,800 |
| 2018 | $2,851 | $104,900 | $36,700 | $68,200 |
| 2017 | $2,760 | $104,900 | $36,700 | $68,200 |
| 2016 | $2,711 | $104,900 | $36,700 | $68,200 |
| 2015 | $2,567 | $98,900 | $36,700 | $62,200 |
| 2014 | $2,511 | $98,900 | $36,700 | $62,200 |
Source: Public Records
Map
Nearby Homes
- 15 Hope Ct
- 58 Read Ave
- 27 Standard Ave
- 70 East St
- 505 Washington St
- 513 Washington St
- 152 Brookside Ave
- 12 Hazard St
- 376 Fairview Ave
- 16 Morris St
- 7 Shippee Ave
- 777 Main St
- 0 Beaulieu Ave
- 2 Duke St Unit D
- 31 Anthony St Unit 33
- 6 Pilgrim Ave
- 11 Seth Dr
- 1567 Centerville Rd
- 6 Legris Commons Ln Unit 5
- 32 Pilgrim Ave
Your Personal Tour Guide
Ask me questions while you tour the home.