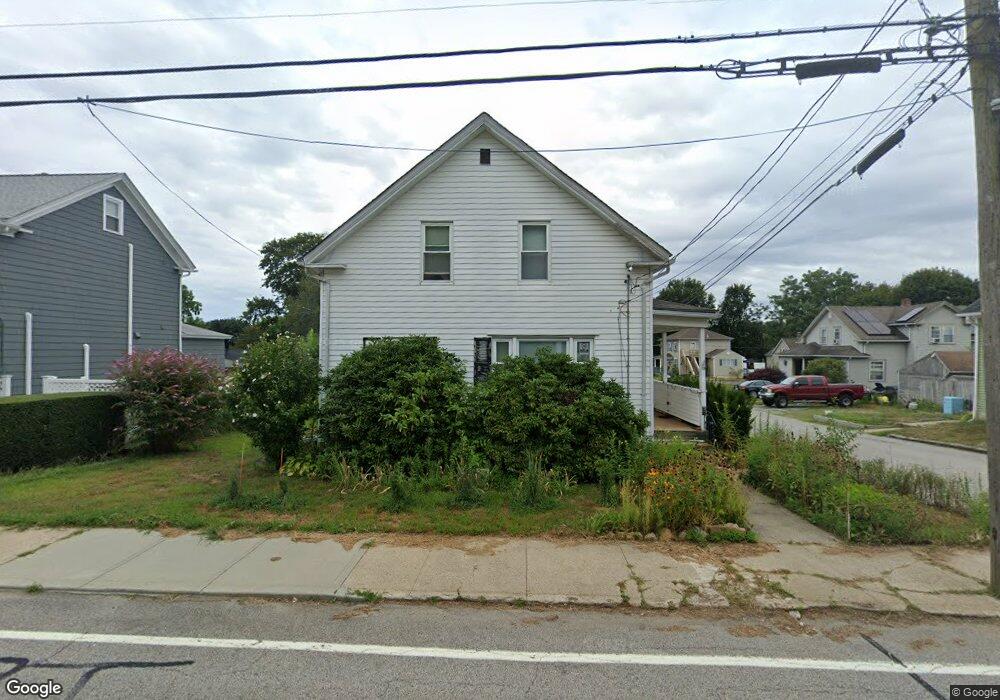
19 Read Ave Coventry, RI 02816
West Warwick Centre NeighborhoodEstimated Value: $340,000 - $381,000
3
Beds
1
Bath
1,443
Sq Ft
$251/Sq Ft
Est. Value
About This Home
This home is located at 19 Read Ave, Coventry, RI 02816 and is currently estimated at $362,257, approximately $251 per square foot. 19 Read Ave is a home located in Kent County with nearby schools including Alan Shawn Feinstein Ms Of Cov and Coventry High School.
Ownership History
Date
Name
Owned For
Owner Type
Purchase Details
Closed on
Jun 9, 2014
Sold by
Senecal Frederick E and Senecal Robert T
Bought by
Senecal Thomas H and Ellis Jennie F
Current Estimated Value
Home Financials for this Owner
Home Financials are based on the most recent Mortgage that was taken out on this home.
Original Mortgage
$61,980
Outstanding Balance
$46,599
Interest Rate
4.36%
Estimated Equity
$315,659
Purchase Details
Closed on
Apr 25, 2014
Sold by
Est Senecal Doris L and Senecal Frederick E
Bought by
Senecal Thomas H and Ellis Jennie F
Home Financials for this Owner
Home Financials are based on the most recent Mortgage that was taken out on this home.
Original Mortgage
$61,980
Outstanding Balance
$46,599
Interest Rate
4.36%
Estimated Equity
$315,659
Create a Home Valuation Report for This Property
The Home Valuation Report is an in-depth analysis detailing your home's value as well as a comparison with similar homes in the area
Home Values in the Area
Average Home Value in this Area
Purchase History
| Date | Buyer | Sale Price | Title Company |
|---|---|---|---|
| Senecal Thomas H | -- | -- | |
| Senecal Thomas H | $60,000 | -- | |
| Est Senecal Doris L | -- | -- | |
| Est Senecal Doris L | -- | -- |
Source: Public Records
Mortgage History
| Date | Status | Borrower | Loan Amount |
|---|---|---|---|
| Open | Est Senecal Doris L | $61,980 |
Source: Public Records
Tax History
| Year | Tax Paid | Tax Assessment Tax Assessment Total Assessment is a certain percentage of the fair market value that is determined by local assessors to be the total taxable value of land and additions on the property. | Land | Improvement |
|---|---|---|---|---|
| 2025 | $3,960 | $246,100 | $75,900 | $170,200 |
| 2024 | $3,898 | $246,100 | $75,900 | $170,200 |
| 2023 | $3,773 | $246,100 | $75,900 | $170,200 |
| 2022 | $3,384 | $172,900 | $72,600 | $100,300 |
| 2021 | $3,354 | $172,900 | $72,600 | $100,300 |
| 2020 | $3,845 | $172,900 | $72,600 | $100,300 |
| 2019 | $2,847 | $128,000 | $35,600 | $92,400 |
| 2018 | $2,766 | $128,000 | $35,600 | $92,400 |
| 2017 | $2,685 | $128,000 | $35,600 | $92,400 |
| 2016 | $3,066 | $143,200 | $52,700 | $90,500 |
| 2015 | $2,983 | $143,200 | $52,700 | $90,500 |
| 2014 | $2,921 | $143,200 | $52,700 | $90,500 |
| 2013 | $2,665 | $142,800 | $41,600 | $101,200 |
Source: Public Records
Map
Nearby Homes
- 15 Hope Ct
- 58 Read Ave
- 505 Washington St
- 513 Washington St
- 27 Standard Ave
- 37 Phillip St
- 176 Archambault Ave
- 12 Hazard St
- 91 Windsor Park Dr
- 16 Morris St
- 0 Beaulieu Ave
- 152 Brookside Ave
- 7 Shippee Ave
- 777 Main St
- 31 Anthony St Unit 33
- 32 Pilgrim Ave
- 2 Duke St Unit D
- 1605 Main St
- 6 Legris Commons Ln Unit 6
- 11 Seth Dr
Your Personal Tour Guide
Ask me questions while you tour the home.