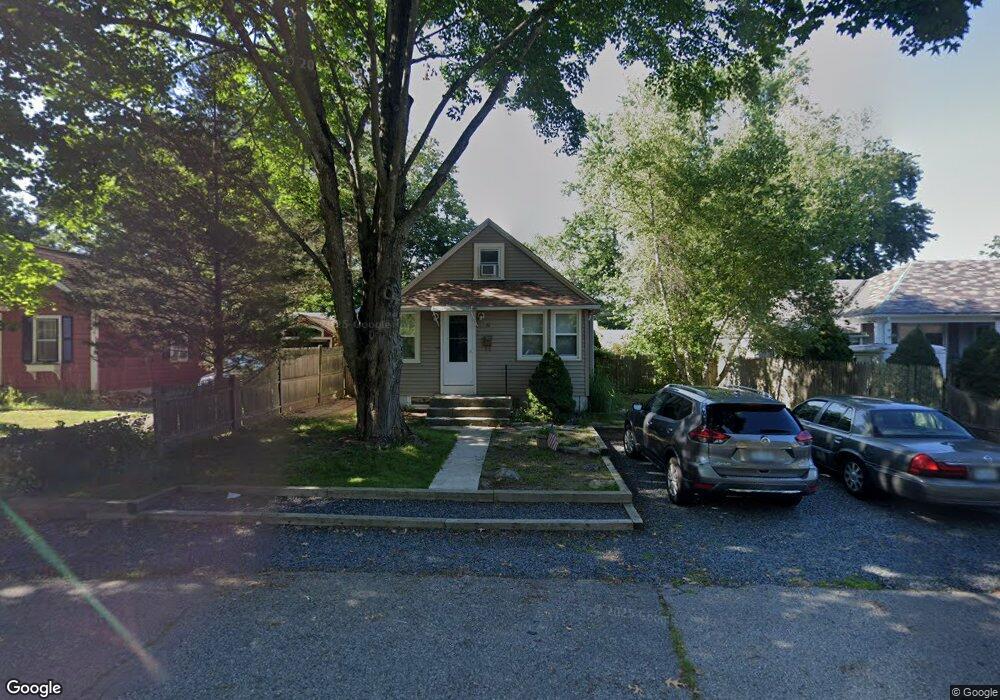
19 Rose St Warwick, RI 02888
Palace Garden NeighborhoodEstimated Value: $347,000 - $375,055
About This Home
This home is located at 19 Rose St, Warwick, RI 02888 and is currently estimated at $363,764, approximately $416 per square foot. 19 Rose St is a home located in Kent County with nearby schools including St. Peter School and Saint Paul School.
Ownership History
We collect this data history from publicly available records. To have your information removed, we recommend requesting removal directly through your county’s website.
Purchase Details
Purchase Details
Home Values in the Area
Average Home Value in this Area
Purchase History
We collect this data history from publicly available records. To have your information removed, we recommend requesting removal directly through your county’s website.
| Date | Buyer | Sale Price | Title Company |
|---|---|---|---|
| $110,000 | -- | ||
| $30,500 | -- |
Mortgage History
We collect this data history from publicly available records. To have your information removed, we recommend requesting removal directly through your county’s website.
| Date | Status | Borrower | Loan Amount |
|---|---|---|---|
| Open | $33,500 | ||
| Open | $160,000 | ||
| Previous Owner | $12,000 |
Tax History
We collect this data history from publicly available records. To have your information removed, we recommend requesting removal directly through your county’s website.
| Year | Tax Paid | Tax Assessment Tax Assessment Total Assessment is a certain percentage of the fair market value that is determined by local assessors to be the total taxable value of land and additions on the property. | Land | Improvement |
|---|---|---|---|---|
| 2025 | $4,009 | $315,700 | $113,200 | $202,500 |
| 2024 | $3,840 | $265,400 | $98,500 | $166,900 |
| 2023 | $3,766 | $265,400 | $98,500 | $166,900 |
| 2022 | $3,504 | $187,100 | $63,000 | $124,100 |
| 2021 | $3,504 | $187,100 | $63,000 | $124,100 |
| 2020 | $3,504 | $187,100 | $63,000 | $124,100 |
| 2019 | $3,504 | $187,100 | $63,000 | $124,100 |
| 2018 | $2,993 | $143,900 | $63,000 | $80,900 |
| 2017 | $2,913 | $143,900 | $63,000 | $80,900 |
| 2016 | $2,913 | $143,900 | $63,000 | $80,900 |
| 2015 | $2,606 | $125,600 | $55,600 | $70,000 |
| 2014 | $2,520 | $125,600 | $55,600 | $70,000 |
| 2013 | $2,486 | $125,600 | $55,600 | $70,000 |
Map
- 31 Todd St
- 39 Merrymount Dr
- 5 Thayer Place
- 1201 Narragansett Pkwy
- 19 Benson Ave
- 19 Crowfield Dr
- 26 Black Creek Ln
- 56 Errol St
- 12 Hannah Dr
- 873 Warwick Ave
- 116 Benbridge Ave
- 21 Falcon Ave
- 222 Harrison Ave
- 417 Squantum Dr
- 268 Washington St
- 550 Algonquin Dr
- 130 Pilgrim Pkwy Unit 5
- 15 Drake Rd
- 50 Lane 2
- 45 Marine Ave
- 23 Rose St
- 9 Rose St
- 26 Rose St
- 37 Rose St
- 12 Rose St
- 19 Elks Ln
- 8 Rose St
- 1040 Narragansett Pkwy
- 1044 Narragansett Pkwy
- 7 Elks Ln
- 40 Rose St
- 43 Rose St
- 46 Rose St
- 47 Rose St
- 1050 Narragansett Pkwy
- 1031 Narragansett Pkwy
- 1041 Narragansett Pkwy
- 1023 Narragansett Pkwy
- 1054 Narragansett Pkwy
- 1015 Narragansett Pkwy
Ask me questions while you tour the home.