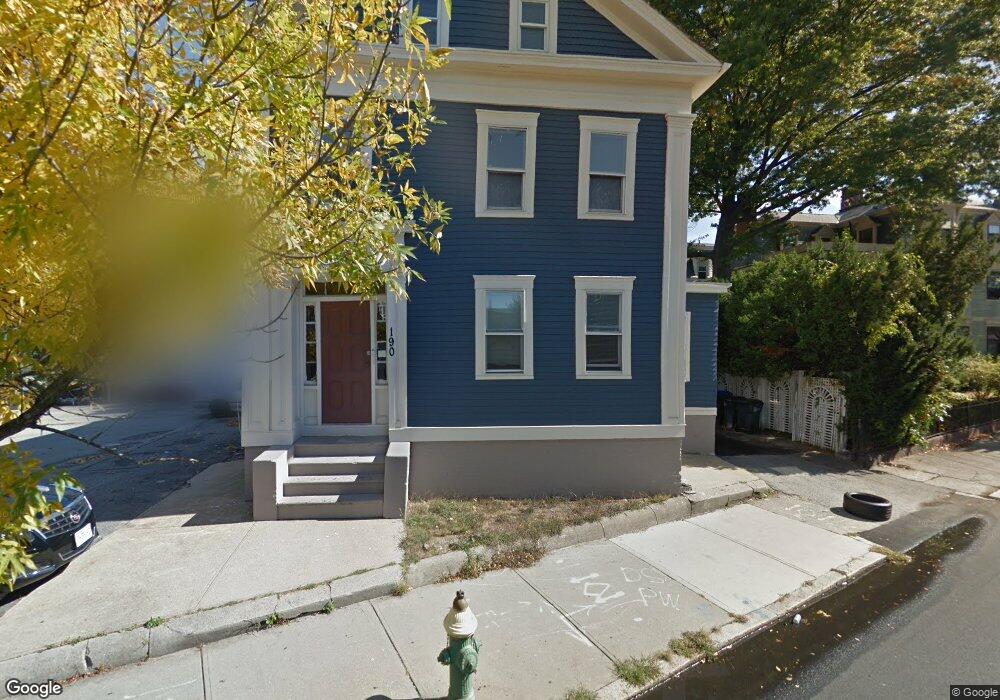
190 Knight St Providence, RI 02909
West End NeighborhoodEstimated Value: $907,000 - $958,000
10
Beds
2
Baths
2,912
Sq Ft
$319/Sq Ft
Est. Value
About This Home
This home is located at 190 Knight St, Providence, RI 02909 and is currently estimated at $929,333, approximately $319 per square foot. 190 Knight St is a home located in Providence County with nearby schools including Paul Cuffee Middle School, Holy Ghost School, and Bradley School—Providence.
Ownership History
Date
Name
Owned For
Owner Type
Purchase Details
Closed on
Jun 17, 2003
Sold by
Connell Christopher J and Connell Dawn A
Bought by
Waterfield Properties
Current Estimated Value
Home Financials for this Owner
Home Financials are based on the most recent Mortgage that was taken out on this home.
Original Mortgage
$150,000
Interest Rate
5.77%
Mortgage Type
Purchase Money Mortgage
Purchase Details
Closed on
Apr 8, 2003
Sold by
Canary Christopher
Bought by
Steckel Maureen and Steckel Theodore C
Home Financials for this Owner
Home Financials are based on the most recent Mortgage that was taken out on this home.
Original Mortgage
$134,925
Interest Rate
5.88%
Mortgage Type
Purchase Money Mortgage
Purchase Details
Closed on
Mar 19, 2001
Sold by
Merola Ralph
Bought by
Marino Richard G and Cahary Christopher
Create a Home Valuation Report for This Property
The Home Valuation Report is an in-depth analysis detailing your home's value as well as a comparison with similar homes in the area
Home Values in the Area
Average Home Value in this Area
Purchase History
| Date | Buyer | Sale Price | Title Company |
|---|---|---|---|
| Waterfield Properties | $192,000 | -- | |
| Steckel Maureen | $180,000 | -- | |
| Marino Richard G | $87,000 | -- |
Source: Public Records
Mortgage History
| Date | Status | Borrower | Loan Amount |
|---|---|---|---|
| Open | Marino Richard G | $186,300 | |
| Closed | Marino Richard G | $150,000 | |
| Previous Owner | Marino Richard G | $134,925 | |
| Previous Owner | Marino Richard G | $17,500 |
Source: Public Records
Tax History
| Year | Tax Paid | Tax Assessment Tax Assessment Total Assessment is a certain percentage of the fair market value that is determined by local assessors to be the total taxable value of land and additions on the property. | Land | Improvement |
|---|---|---|---|---|
| 2025 | $12,169 | $869,200 | $256,700 | $612,500 |
| 2024 | $11,538 | $628,800 | $207,300 | $421,500 |
| 2023 | $11,538 | $628,800 | $207,300 | $421,500 |
| 2022 | $11,193 | $628,800 | $207,300 | $421,500 |
| 2021 | $9,704 | $395,100 | $132,300 | $262,800 |
| 2020 | $9,704 | $395,100 | $132,300 | $262,800 |
| 2019 | $8,090 | $329,400 | $132,300 | $197,100 |
| 2018 | $5,916 | $185,100 | $76,500 | $108,600 |
| 2017 | $5,916 | $185,100 | $76,500 | $108,600 |
| 2016 | $5,916 | $185,100 | $76,500 | $108,600 |
| 2015 | $5,478 | $165,500 | $76,500 | $89,000 |
| 2014 | $5,586 | $165,500 | $76,500 | $89,000 |
| 2013 | $5,586 | $165,500 | $76,500 | $89,000 |
Source: Public Records
Map
Nearby Homes
- 25 Brighton St
- 102 Vinton St
- 78 Penn St
- 159 Sutton St
- 5 Lee St
- 104 Tell St
- 12 Louisburg Place
- 107 Ring St
- 336 Atwells Ave
- 143 Tell St Unit B
- 236 Broadway
- 498 Broadway
- 1268 Westminster St Unit 300
- 86 Tobey St
- 24 Vernon St Unit B
- 61 De Pasquale Ave
- 1447 Westminster St Unit 1C
- 3 Pallas St
- 25 Kenyon St
- 1516 Westminster St
Your Personal Tour Guide
Ask me questions while you tour the home.