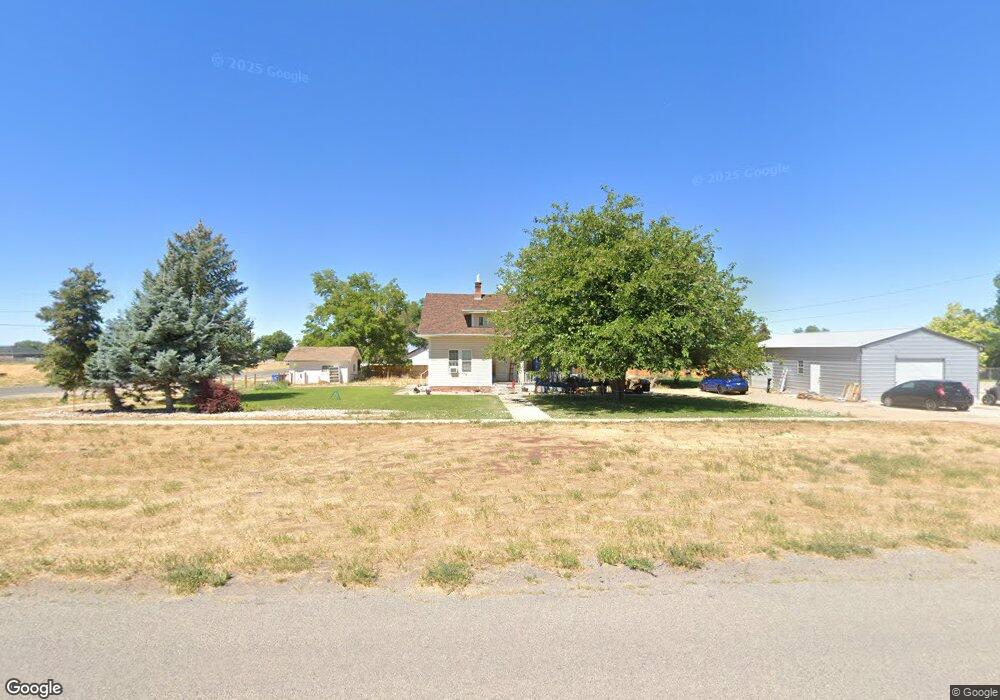
190 S 200 W Fillmore, UT 84631
Estimated Value: $324,000 - $354,000
6
Beds
2
Baths
2,112
Sq Ft
$160/Sq Ft
Est. Value
About This Home
This home is located at 190 S 200 W, Fillmore, UT 84631 and is currently estimated at $338,797, approximately $160 per square foot. 190 S 200 W is a home located in Millard County.
Ownership History
Date
Name
Owned For
Owner Type
Purchase Details
Closed on
Mar 9, 2026
Sold by
Joshua Fako and Fako Summer B
Bought by
Duncan David
Current Estimated Value
Home Financials for this Owner
Home Financials are based on the most recent Mortgage that was taken out on this home.
Original Mortgage
$340,000
Outstanding Balance
$340,000
Interest Rate
6.09%
Mortgage Type
VA
Estimated Equity
-$1,203
Purchase Details
Closed on
May 1, 2019
Sold by
Mortensen Deborah T and Mortensen Gordon D
Bought by
Fako Joshua and Fako Summer B
Home Financials for this Owner
Home Financials are based on the most recent Mortgage that was taken out on this home.
Original Mortgage
$221,306
Interest Rate
4.37%
Mortgage Type
FHA
Create a Home Valuation Report for This Property
The Home Valuation Report is an in-depth analysis detailing your home's value as well as a comparison with similar homes in the area
Home Values in the Area
Average Home Value in this Area
Purchase History
| Date | Buyer | Sale Price | Title Company |
|---|---|---|---|
| Duncan David | -- | First American Title Insurance | |
| Fako Joshua | -- | First American Title |
Source: Public Records
Mortgage History
| Date | Status | Borrower | Loan Amount |
|---|---|---|---|
| Open | Duncan David | $340,000 | |
| Previous Owner | Fako Joshua | $221,306 |
Source: Public Records
Tax History
| Year | Tax Paid | Tax Assessment Tax Assessment Total Assessment is a certain percentage of the fair market value that is determined by local assessors to be the total taxable value of land and additions on the property. | Land | Improvement |
|---|---|---|---|---|
| 2025 | $1,780 | $223,509 | $28,865 | $194,644 |
| 2024 | $1,780 | $171,497 | $22,598 | $148,899 |
| 2023 | $1,837 | $171,497 | $22,598 | $148,899 |
| 2022 | $1,461 | $131,164 | $20,544 | $110,620 |
| 2021 | $1,285 | $110,791 | $13,340 | $97,451 |
| 2020 | $1,054 | $91,396 | $12,128 | $79,268 |
| 2019 | $830 | $72,164 | $12,128 | $60,036 |
| 2018 | $792 | $70,470 | $12,128 | $58,342 |
| 2017 | $701 | $59,338 | $10,890 | $48,448 |
| 2016 | $671 | $59,338 | $10,890 | $48,448 |
| 2015 | $671 | $59,338 | $10,890 | $48,448 |
| 2014 | -- | $59,338 | $10,890 | $48,448 |
| 2013 | -- | $59,338 | $10,890 | $48,448 |
Source: Public Records
Map
Nearby Homes
Your Personal Tour Guide
Ask me questions while you tour the home.