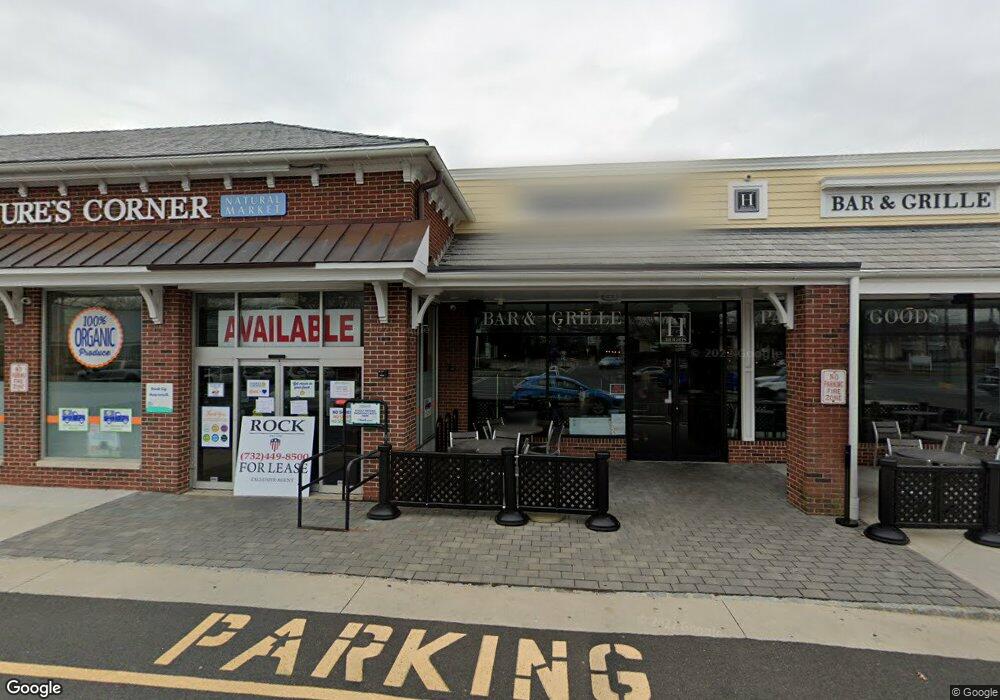
1901 State Route 71 Unit 3D Belmar, NJ 07719
--
Bed
--
Bath
21,197
Sq Ft
0.92
Acres Lot
About This Home
This home is located at 1901 State Route 71 Unit 3D, Belmar, NJ 07719. 1901 State Route 71 Unit 3D is a home located in Monmouth County with nearby schools including Wall High School, St. Rose Grammar School, and St Rose High School.
Create a Home Valuation Report for This Property
The Home Valuation Report is an in-depth analysis detailing your home's value as well as a comparison with similar homes in the area
Home Values in the Area
Average Home Value in this Area
Map
Nearby Homes
- 1017 18th Ave
- 1903 Margerum Ave
- 1909 Cottage Place
- 1805 Margerum Ave
- 724 19th Ave
- 327 South Blvd
- 1747 Brand Pkwy
- 1900 Main St
- 1726 M St
- 2121 4th Ave
- 1809 Fernwood Rd
- 217 Pitney Ave
- 1812 Fernwood Rd Unit 2
- 939 Woodland Ave
- 1615 State Route 71
- 1731 Grove St
- 3 Ashford Ct
- 1808 Pine Terrace Unit 2
- 1827 Laurel Terrace
- 520 18th Ave
- 1901 State Route 71 Unit 1C
- 1901 State Route 71
- 1901 State Route 71 Unit 301
- 1901 State Route 71 Unit 2d
- 1901 State Route 71 Unit 3c
- 1901 State Route 71 Unit 1a
- 1901 New Jersey 71
- 1915 State Route 71
- 1915 State Route 71
- 1917 State Route 71
- 905 5th Ave
- 1914 Campmeeting St
- 908 4th Ave
- 913 5th Ave
- 906 5th Ave
- 911 4th Ave
- 904 3rd Ave
- 916 4th Ave
- 1900 World St
- 1817 Campmeeting St
Your Personal Tour Guide
Ask me questions while you tour the home.