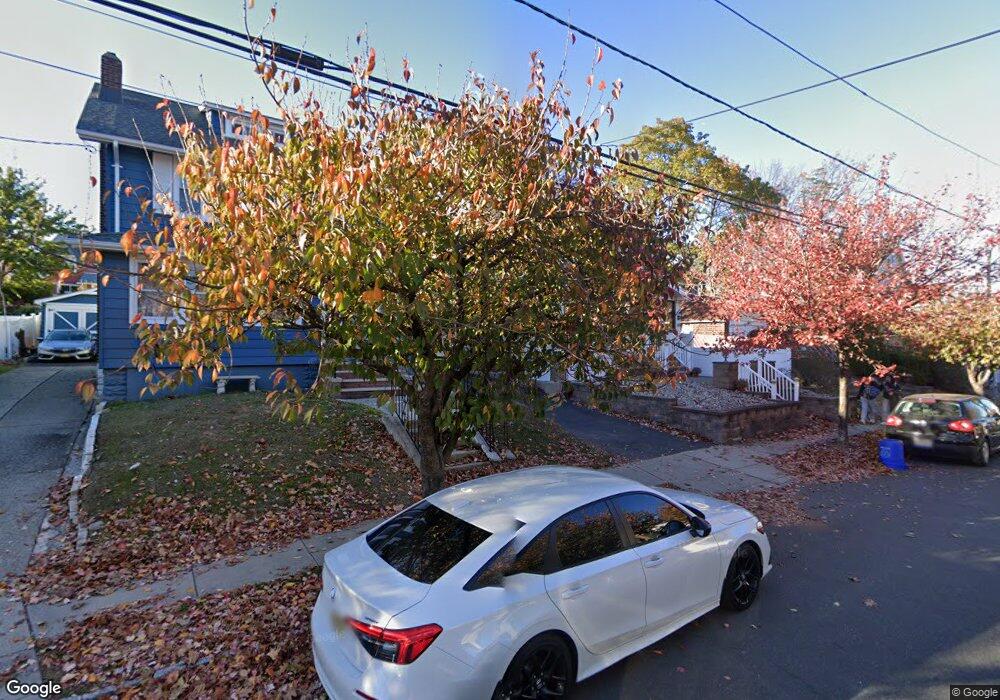
191 New St Belleville, NJ 07109
Estimated Value: $575,000 - $718,000
Studio
--
Bath
1,741
Sq Ft
$368/Sq Ft
Est. Value
About This Home
This home is located at 191 New St, Belleville, NJ 07109 and is currently estimated at $641,276, approximately $368 per square foot. 191 New St is a home located in Essex County with nearby schools including Belleville High School and St. Peter Elementary School.
Ownership History
Date
Name
Owned For
Owner Type
Purchase Details
Closed on
Dec 22, 2006
Sold by
Castro Javier
Bought by
Olivo Antonio
Current Estimated Value
Home Financials for this Owner
Home Financials are based on the most recent Mortgage that was taken out on this home.
Original Mortgage
$350,320
Interest Rate
7.37%
Mortgage Type
Adjustable Rate Mortgage/ARM
Purchase Details
Closed on
Jan 21, 2000
Sold by
Cafone James
Bought by
Castro Javier
Home Financials for this Owner
Home Financials are based on the most recent Mortgage that was taken out on this home.
Original Mortgage
$131,100
Interest Rate
8.15%
Create a Home Valuation Report for This Property
The Home Valuation Report is an in-depth analysis detailing your home's value as well as a comparison with similar homes in the area
Home Values in the Area
Average Home Value in this Area
Purchase History
| Date | Buyer | Sale Price | Title Company |
|---|---|---|---|
| Olivo Antonio | $437,900 | -- | |
| Castro Javier | $138,000 | -- |
Source: Public Records
Mortgage History
| Date | Status | Borrower | Loan Amount |
|---|---|---|---|
| Previous Owner | Olivo Antonio | $350,320 | |
| Previous Owner | Castro Javier | $131,100 |
Source: Public Records
Tax History
| Year | Tax Paid | Tax Assessment Tax Assessment Total Assessment is a certain percentage of the fair market value that is determined by local assessors to be the total taxable value of land and additions on the property. | Land | Improvement |
|---|---|---|---|---|
| 2025 | $11,506 | $285,300 | $134,300 | $151,000 |
| 2024 | $11,167 | $285,300 | $134,300 | $151,000 |
| 2022 | $10,987 | $285,300 | $134,300 | $151,000 |
| 2021 | $10,827 | $285,300 | $134,300 | $151,000 |
| 2020 | $10,679 | $285,300 | $134,300 | $151,000 |
| 2019 | $10,102 | $285,300 | $134,300 | $151,000 |
| 2018 | $10,330 | $257,600 | $136,400 | $121,200 |
| 2017 | $9,987 | $257,600 | $136,400 | $121,200 |
| 2016 | $9,876 | $257,600 | $136,400 | $121,200 |
| 2015 | $9,542 | $257,600 | $136,400 | $121,200 |
| 2014 | $9,286 | $257,600 | $136,400 | $121,200 |
Source: Public Records
Map
Nearby Homes
- 279 Joralemon St
- 138 Cedar Hill Ave
- 344 Joralemon St
- 234 Holmes St
- 31 Mertz Ave
- 88 Columbus Ave
- 182 Union Ave
- 126 Garden Ave
- 190 Malone Ave
- 66 Garden Ave
- 50 Division Ave
- 48 Division Ave Unit 50
- 25-27 New St
- 25 New St Unit 27
- 32 Fairview Place
- 20-22 Washington Ave
- 55 Walnut St
- 476 Joralemon St Unit 4
- 76 Holmes St
- 89 Union Ave
Your Personal Tour Guide
Ask me questions while you tour the home.