1910 Rustling Oak Dayton, OH 45459
Woodbourne-Hyde Park NeighborhoodEstimated Value: $683,000 - $774,000
4
Beds
6
Baths
4,425
Sq Ft
$168/Sq Ft
Est. Value
About This Home
This home is located at 1910 Rustling Oak, Dayton, OH 45459 and is currently estimated at $742,938, approximately $167 per square foot. 1910 Rustling Oak is a home located in Montgomery County with nearby schools including Primary Village North, John Hole Elementary, and Hadley E Watts Middle School.
Ownership History
Date
Name
Owned For
Owner Type
Purchase Details
Closed on
Apr 17, 2014
Sold by
Eichert Stephen J and Barbara Eichert H
Bought by
Burke Stephen P
Current Estimated Value
Purchase Details
Closed on
Jan 11, 2008
Sold by
Hochwalt John C and Hochwalt Deborah L
Bought by
Eichert Stephen J and Eichert Barbara H
Home Financials for this Owner
Home Financials are based on the most recent Mortgage that was taken out on this home.
Original Mortgage
$326,400
Interest Rate
6.22%
Mortgage Type
Purchase Money Mortgage
Purchase Details
Closed on
Jan 16, 2002
Sold by
Hochwalt John J
Bought by
Katherine E Hochwalt Revocable Living Tr
Purchase Details
Closed on
Jan 24, 2000
Sold by
Catherine Stychno Mary
Bought by
Hochwalt John C and Hochwalt Deborah L
Home Financials for this Owner
Home Financials are based on the most recent Mortgage that was taken out on this home.
Original Mortgage
$267,200
Interest Rate
7.96%
Purchase Details
Closed on
Jan 15, 1999
Sold by
Wicker Richard K and Wicker Judy S
Bought by
Stychno Mary Catherine
Home Financials for this Owner
Home Financials are based on the most recent Mortgage that was taken out on this home.
Original Mortgage
$304,000
Interest Rate
5.62%
Create a Home Valuation Report for This Property
The Home Valuation Report is an in-depth analysis detailing your home's value as well as a comparison with similar homes in the area
Home Values in the Area
Average Home Value in this Area
Purchase History
| Date | Buyer | Sale Price | Title Company |
|---|---|---|---|
| Burke Stephen P | $550,000 | None Available | |
| Eichert Stephen J | $612,000 | Attorney | |
| Katherine E Hochwalt Revocable Living Tr | -- | -- | |
| Hochwalt John C | $334,000 | -- | |
| Stychno Mary Catherine | $380,000 | Midland Title Security Inc |
Source: Public Records
Mortgage History
| Date | Status | Borrower | Loan Amount |
|---|---|---|---|
| Previous Owner | Eichert Stephen J | $326,400 | |
| Previous Owner | Hochwalt John C | $267,200 | |
| Previous Owner | Stychno Mary Catherine | $304,000 |
Source: Public Records
Tax History
| Year | Tax Paid | Tax Assessment Tax Assessment Total Assessment is a certain percentage of the fair market value that is determined by local assessors to be the total taxable value of land and additions on the property. | Land | Improvement |
|---|---|---|---|---|
| 2025 | $19,981 | $292,760 | $27,720 | $265,040 |
| 2024 | $18,390 | $292,760 | $27,720 | $265,040 |
| 2023 | $18,390 | $292,760 | $27,720 | $265,040 |
| 2022 | $17,651 | $222,350 | $21,000 | $201,350 |
| 2021 | $17,700 | $222,350 | $21,000 | $201,350 |
| 2020 | $17,675 | $222,350 | $21,000 | $201,350 |
| 2019 | $18,583 | $208,930 | $21,000 | $187,930 |
| 2018 | $16,637 | $208,930 | $21,000 | $187,930 |
| 2017 | $16,475 | $208,930 | $21,000 | $187,930 |
| 2016 | $15,134 | $185,420 | $21,000 | $164,420 |
| 2015 | $14,889 | $185,420 | $21,000 | $164,420 |
| 2014 | $14,889 | $185,420 | $21,000 | $164,420 |
| 2012 | -- | $131,400 | $29,750 | $101,650 |
Source: Public Records
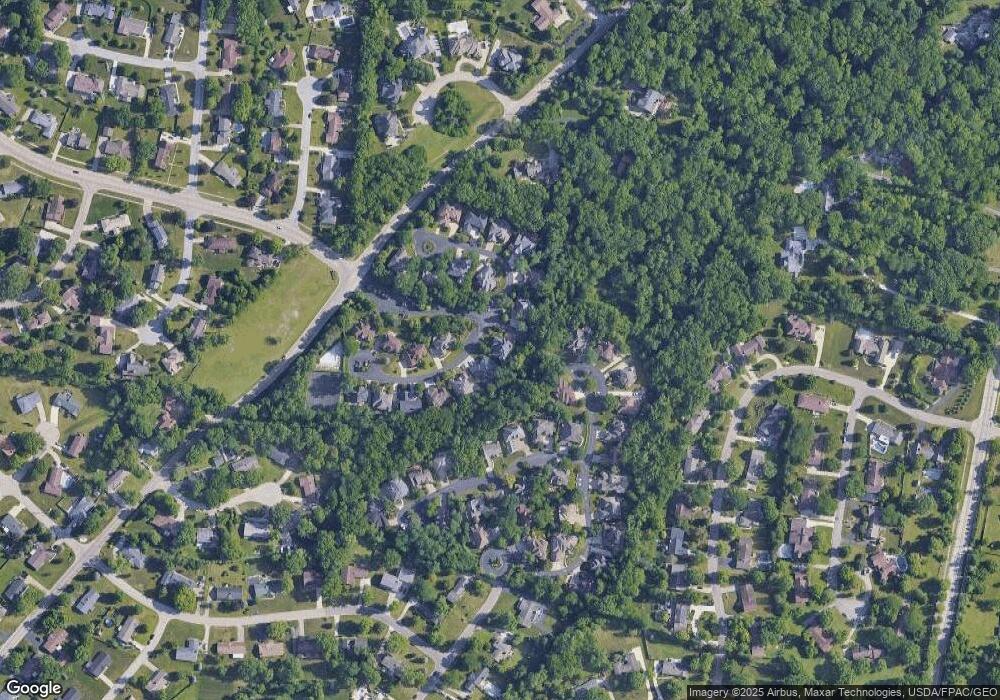
Map
Nearby Homes
- 1940 Alda Ct
- 1963 Scenic Hills Ct
- 1931 Alda Ct
- 7226 Barr Cir
- 2151 Vienna Pkwy
- 6623 Cedar Crest Trail
- 6524 Halberd Ct
- 7250 Southpoint Dr
- 6571 Swissway Dr
- 2310 Wood Trails Ct
- 2303 Delvue Dr
- 6800 Vienna Woods Trail
- 1221 Wood Mill Trail
- 2308 Vienna Pkwy
- 1524 Lindenhurst Dr
- 3135 Simpson Ct
- 3135 Simpson Ct Unit 8313
- 6864 Rose Glen Dr
- 460 Crossing Ln Unit 8299
- 474 Crossing Ln Unit 8298
- 1920 Rustling Oak
- 1911 Arbor Walk
- 1926 Rustling Oak
- 1929 Rustling Oak
- 1924 Arbor Walk
- 120 Rustling Oak Ct
- 1915 Arbor Walk
- 7101 Hunters Creek
- 7100 Hunters Creek
- 1932 Rustling Oak
- 1935 Rustling Oak
- 1928 Arbor Walk
- 7190 Hunters Creek
- 7190 Hunters Creek Dr
- 7184 Hunters Creek
- 1940 Arbor Walk
- 1919 Arbor Walk
- 1951 Scenic Hills
- 7104 Hunters Creek Dr
- 7104 Hunters Creek
Your Personal Tour Guide
Ask me questions while you tour the home.