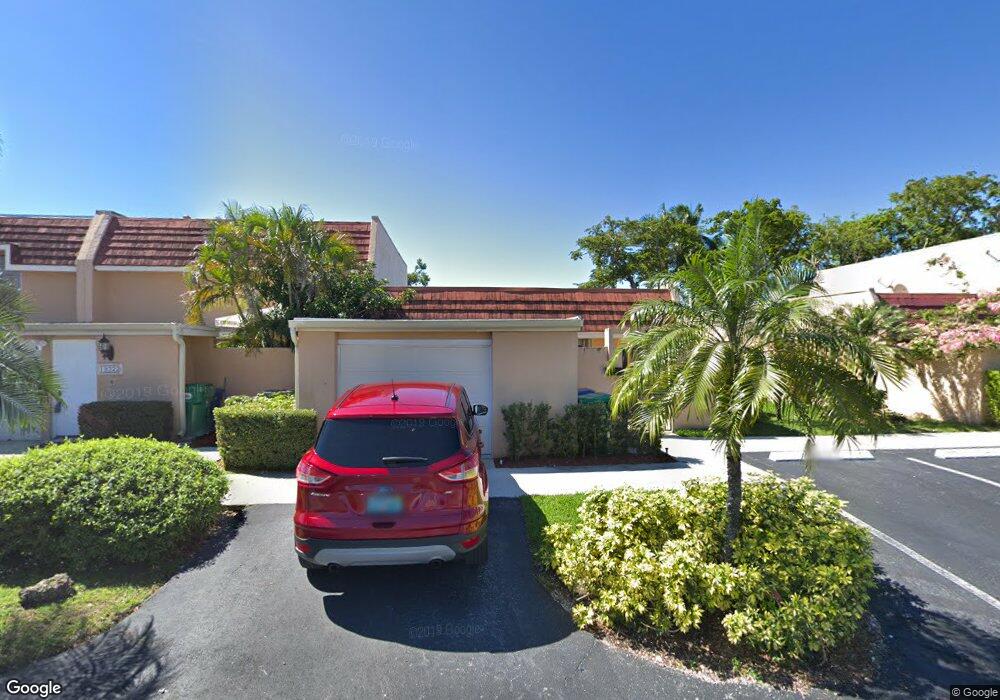
19328 Bobolink Dr Hialeah, FL 33015
Estimated Value: $437,609 - $458,000
3
Beds
2
Baths
1,465
Sq Ft
$307/Sq Ft
Est. Value
About This Home
This home is located at 19328 Bobolink Dr, Hialeah, FL 33015 and is currently estimated at $449,902, approximately $307 per square foot. 19328 Bobolink Dr is a home located in Miami-Dade County with nearby schools including Spanish Lake Elementary School, Country Club Middle School, and American Senior High School.
Ownership History
Date
Name
Owned For
Owner Type
Purchase Details
Closed on
Jul 31, 2023
Sold by
Crosson Harry H and Crosson Virginia
Bought by
Clk Brothers Llc
Current Estimated Value
Home Financials for this Owner
Home Financials are based on the most recent Mortgage that was taken out on this home.
Original Mortgage
$228,750
Outstanding Balance
$223,681
Interest Rate
6.96%
Mortgage Type
New Conventional
Estimated Equity
$226,221
Purchase Details
Closed on
Sep 4, 2001
Sold by
Harry H Crosson I
Bought by
Crosson Harry H and Little Sharon
Purchase Details
Closed on
Dec 9, 1996
Sold by
Fontanella Gerri J and Light Peter A
Bought by
Crosson Harry H and Crosson Charlene R
Purchase Details
Closed on
Aug 13, 1993
Sold by
Stephans Edwina
Bought by
Fontanella Gerri J
Home Financials for this Owner
Home Financials are based on the most recent Mortgage that was taken out on this home.
Original Mortgage
$73,800
Interest Rate
7.19%
Create a Home Valuation Report for This Property
The Home Valuation Report is an in-depth analysis detailing your home's value as well as a comparison with similar homes in the area
Home Values in the Area
Average Home Value in this Area
Purchase History
We collect this data history from publicly available records. To have your information removed, we recommend requesting removal directly through your county’s website.
| Date | Buyer | Sale Price | Title Company |
|---|---|---|---|
| Clk Brothers Llc | $305,000 | Title Of Miami | |
| Clk Brothers Llc | $305,000 | Title Of Miami | |
| Crosson Harry H | $100 | -- | |
| Crosson Harry H | $93,000 | -- | |
| Fontanella Gerri J | $82,000 | -- |
Source: Public Records
Mortgage History
We collect this data history from publicly available records. To have your information removed, we recommend requesting removal directly through your county’s website.
| Date | Status | Borrower | Loan Amount |
|---|---|---|---|
| Open | Clk Brothers Llc | $228,750 | |
| Closed | Clk Brothers Llc | $228,750 | |
| Previous Owner | Fontanella Gerri J | $73,800 |
Source: Public Records
Tax History
| Year | Tax Paid | Tax Assessment Tax Assessment Total Assessment is a certain percentage of the fair market value that is determined by local assessors to be the total taxable value of land and additions on the property. | Land | Improvement |
|---|---|---|---|---|
| 2025 | $7,114 | $389,070 | -- | -- |
| 2024 | $1,798 | $378,613 | -- | -- |
| 2023 | $1,798 | $118,550 | $0 | $0 |
| 2022 | $1,775 | $115,098 | $0 | $0 |
| 2021 | $1,737 | $111,746 | $0 | $0 |
| 2020 | $1,716 | $110,204 | $0 | $0 |
| 2019 | $1,676 | $107,727 | $0 | $0 |
| 2018 | $0 | $105,719 | $0 | $0 |
| 2017 | $1,568 | $103,545 | $0 | $0 |
| 2016 | $1,533 | $101,416 | $0 | $0 |
| 2015 | $1,496 | $100,712 | $0 | $0 |
| 2014 | $1,496 | $99,913 | $0 | $0 |
Source: Public Records
Map
Nearby Homes
- 19174 Bobolink Dr
- 19922 NW 67th Place
- 6745 NW 192nd Ln
- 19265 E Saint Andrews Dr
- 6771 NW 199th Terrace
- 19804 NW 67th Ct
- 19903 NW 67th Ct
- 6722 NW 192nd Ln
- 6708 NW 193rd Terrace
- 19252 NW 65th Ct
- 19750 Cypress Ct
- 6723 NW 188th Terrace
- 6725 NW 188th Terrace
- 19150 S Saint Andrews Dr
- 6890 Winged Foot Dr
- 6795 Brookline Dr Unit 6795
- 6821 Brookline Dr Unit 6821
- 6782 Brookline Dr Unit 6782
- 19740 W Saint Andrews Dr
- 19633 NW 62nd Place
- 19262 Bobolink Dr
- 19300 Bobolink Dr
- 19256 Bobolink Dr
- 19306 Bobolink Dr
- 19312 Bobolink Dr
- 19250 Bobolink Dr
- 19318 Bobolink Dr
- 19246 Bobolink Dr
- 19322 Bob-O-link Dr
- 19322 Bobolink Dr Unit 19322
- 19322 Bobolink Dr Unit N
- 19322 Bobolink Dr
- 19240 Bobolink Dr
- 19236 Bobolink Dr
- 6764 NW 199th St
- 19334 Bobolink Dr
- 19230 Bobolink Dr
- 6767 NW 193rd Ln
- 6757 NW 189 Te
- 19224 Bobolink Dr
Your Personal Tour Guide
Ask me questions while you tour the home.