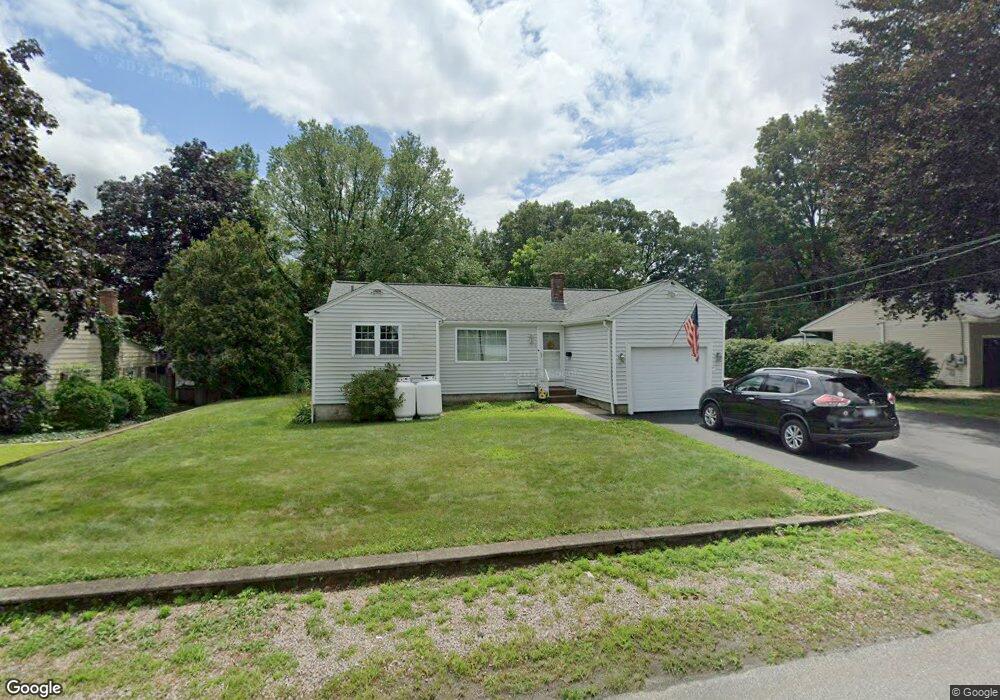
195 Campeau St Woonsocket, RI 02895
East Woonsocket NeighborhoodEstimated Value: $383,000 - $422,000
2
Beds
1
Bath
1,227
Sq Ft
$327/Sq Ft
Est. Value
About This Home
This home is located at 195 Campeau St, Woonsocket, RI 02895 and is currently estimated at $401,316, approximately $327 per square foot. 195 Campeau St is a home located in Providence County with nearby schools including Woonsocket High School and Good Shepherd Catholic School.
Ownership History
Date
Name
Owned For
Owner Type
Purchase Details
Closed on
Jun 29, 2011
Sold by
Fnma
Bought by
Emmett Jason C
Current Estimated Value
Home Financials for this Owner
Home Financials are based on the most recent Mortgage that was taken out on this home.
Original Mortgage
$4,290
Outstanding Balance
$164
Interest Rate
4.62%
Estimated Equity
$401,152
Purchase Details
Closed on
Apr 18, 2011
Sold by
Pincince Donald E
Bought by
Federal National Mortgage Association
Create a Home Valuation Report for This Property
The Home Valuation Report is an in-depth analysis detailing your home's value as well as a comparison with similar homes in the area
Home Values in the Area
Average Home Value in this Area
Purchase History
We collect this data history from publicly available records. To have your information removed, we recommend requesting removal directly through your county’s website.
| Date | Buyer | Sale Price | Title Company |
|---|---|---|---|
| Emmett Jason C | $92,000 | -- | |
| Federal National Mortgage Association | $179,227 | -- | |
| Emmett Jason C | $92,000 | -- | |
| Federal National Mortgage Association | $179,227 | -- |
Source: Public Records
Mortgage History
We collect this data history from publicly available records. To have your information removed, we recommend requesting removal directly through your county’s website.
| Date | Status | Borrower | Loan Amount |
|---|---|---|---|
| Open | Federal National Mortgage Association | $4,290 |
Source: Public Records
Tax History
| Year | Tax Paid | Tax Assessment Tax Assessment Total Assessment is a certain percentage of the fair market value that is determined by local assessors to be the total taxable value of land and additions on the property. | Land | Improvement |
|---|---|---|---|---|
| 2025 | $3,906 | $347,800 | $113,800 | $234,000 |
| 2024 | $3,158 | $217,200 | $92,800 | $124,400 |
| 2023 | $3,036 | $217,200 | $92,800 | $124,400 |
| 2022 | $3,036 | $217,200 | $92,800 | $124,400 |
| 2021 | $3,755 | $158,100 | $74,300 | $83,800 |
| 2020 | $3,794 | $158,100 | $74,300 | $83,800 |
| 2018 | $3,807 | $158,100 | $74,300 | $83,800 |
| 2017 | $3,919 | $130,200 | $68,900 | $61,300 |
| 2016 | $4,146 | $130,200 | $68,900 | $61,300 |
| 2015 | $4,763 | $130,200 | $68,900 | $61,300 |
| 2014 | $4,776 | $132,900 | $75,800 | $57,100 |
Source: Public Records
Map
Nearby Homes
- 72 Wayne Rd
- 74 Henry St
- 75 Kenwood St
- 628 Robinson St
- 68 Kenwood St
- 86 Fall St
- 366 Aylsworth Ave
- 77 Theresa Marie Ave
- 76 Sweet Ave
- 120 Grange Ave
- 1175 Diamond Hill Rd Unit 305
- 0 Robinson St
- 7 Theresa Marie Ave
- 213 St Louis Ave
- 375 Congress St
- 124 Saint Leon Ave
- 212 Saint Louis Ave
- 68 Madeleine Ave
- 79 Saint Agnes Ave
- 200 Saint Louis Ave
Your Personal Tour Guide
Ask me questions while you tour the home.