Estimated Value: $394,000 - $431,000
Studio
--
Bath
1,659
Sq Ft
$245/Sq Ft
Est. Value
About This Home
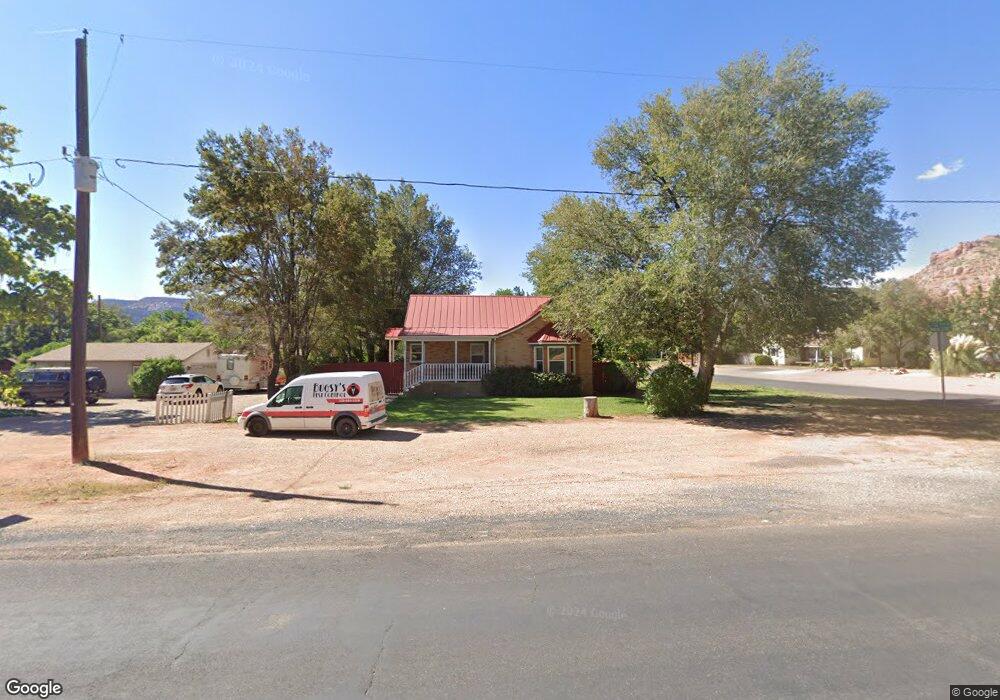
This home is located at 195 N Main St, Kanab, UT 84741 and is currently estimated at $407,216, approximately $245 per square foot. 195 N Main St is a home located in Kane County with nearby schools including Kanab Elementary School, Kanab Middle School, and Kanab High School.
Ownership History
Date
Name
Owned For
Owner Type
Purchase Details
Closed on
May 14, 2014
Sold by
Andrea Andrea
Bought by
Kelly Ginger
Current Estimated Value
Purchase Details
Closed on
May 15, 2013
Sold by
Quinby James C
Bought by
Gutierrez Andres
Home Financials for this Owner
Home Financials are based on the most recent Mortgage that was taken out on this home.
Original Mortgage
$130,612
Interest Rate
3.41%
Purchase Details
Closed on
Jul 23, 2007
Sold by
Mcdonnell Vicki C
Bought by
Quinby James C
Home Financials for this Owner
Home Financials are based on the most recent Mortgage that was taken out on this home.
Original Mortgage
$199,500
Interest Rate
6.51%
Create a Home Valuation Report for This Property
The Home Valuation Report is an in-depth analysis detailing your home's value as well as a comparison with similar homes in the area
Home Values in the Area
Average Home Value in this Area
Purchase History
| Date | Buyer | Sale Price | Title Company |
|---|---|---|---|
| Kelly Ginger | -- | -- | |
| Gutierrez Andres | -- | -- | |
| Quinby James C | -- | -- |
Source: Public Records
Mortgage History
| Date | Status | Borrower | Loan Amount |
|---|---|---|---|
| Previous Owner | Gutierrez Andres | $130,612 | |
| Previous Owner | Quinby James C | $199,500 |
Source: Public Records
Tax History
| Year | Tax Paid | Tax Assessment Tax Assessment Total Assessment is a certain percentage of the fair market value that is determined by local assessors to be the total taxable value of land and additions on the property. | Land | Improvement |
|---|---|---|---|---|
| 2025 | $3,059 | $356,568 | $107,825 | $248,743 |
| 2024 | $3,148 | $201,190 | $48,740 | $152,450 |
| 2023 | $2,825 | $185,010 | $46,419 | $138,591 |
| 2022 | $2,493 | $161,698 | $35,707 | $125,991 |
| 2021 | $2,257 | $219,625 | $49,940 | $169,685 |
| 2020 | $2,179 | $205,881 | $45,400 | $160,481 |
| 2019 | $1,968 | $181,115 | $45,276 | $135,839 |
| 2018 | $1,903 | $173,569 | $37,730 | $135,839 |
| 2017 | $1,839 | $160,223 | $34,300 | $125,923 |
| 2016 | $1,588 | $134,279 | $34,300 | $99,979 |
| 2015 | $771 | $127,870 | $34,300 | $93,570 |
| 2014 | $771 | $117,889 | $36,771 | $81,118 |
| 2013 | -- | $117,889 | $0 | $0 |
Source: Public Records
Map
Nearby Homes
Your Personal Tour Guide
Ask me questions while you tour the home.