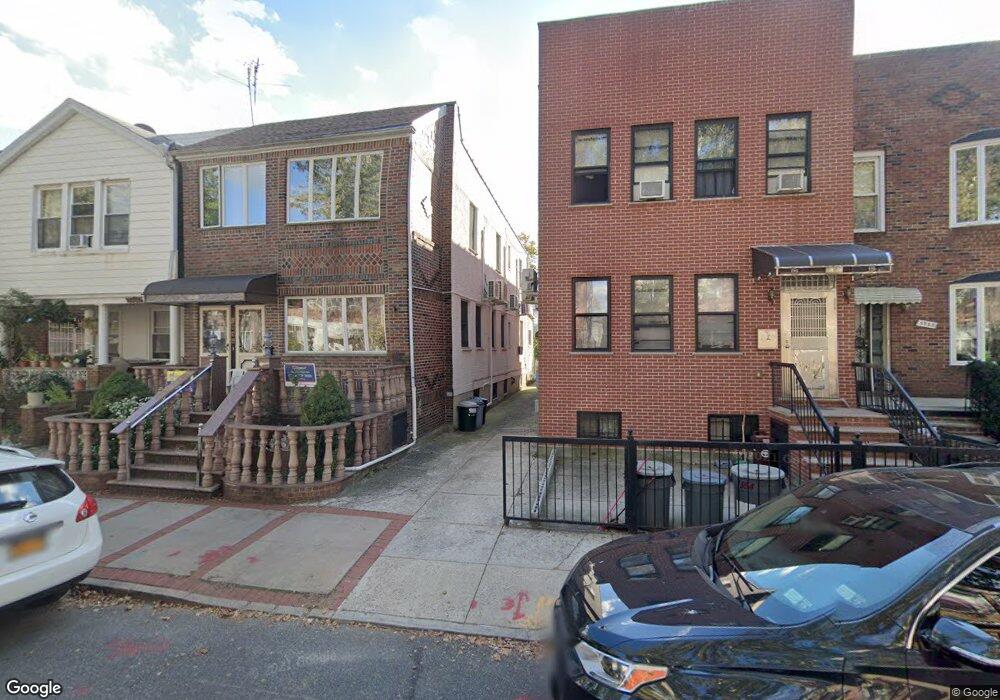
1954 73rd St Brooklyn, NY 11204
Bensonhurst NeighborhoodEstimated Value: $1,318,056 - $1,744,000
3
Beds
2
Baths
2,352
Sq Ft
$665/Sq Ft
Est. Value
About This Home
This home is located at 1954 73rd St, Brooklyn, NY 11204 and is currently estimated at $1,563,014, approximately $664 per square foot. 1954 73rd St is a home located in Kings County with nearby schools including P.S. 186 Dr. Irving A. Gladstone Elementary School, Seth Low Intermediate School 96, and New Utrecht High School.
Ownership History
Date
Name
Owned For
Owner Type
Purchase Details
Closed on
Jul 28, 2009
Sold by
Mendez Jose
Bought by
Chen Wei and Chen Zhao Xu
Current Estimated Value
Home Financials for this Owner
Home Financials are based on the most recent Mortgage that was taken out on this home.
Original Mortgage
$472,000
Outstanding Balance
$297,205
Interest Rate
5.19%
Mortgage Type
Purchase Money Mortgage
Estimated Equity
$1,265,809
Create a Home Valuation Report for This Property
The Home Valuation Report is an in-depth analysis detailing your home's value as well as a comparison with similar homes in the area
Home Values in the Area
Average Home Value in this Area
Purchase History
We collect this data history from publicly available records. To have your information removed, we recommend requesting removal directly through your county’s website.
| Date | Buyer | Sale Price | Title Company |
|---|---|---|---|
| Chen Wei | $675,000 | -- |
Source: Public Records
Mortgage History
We collect this data history from publicly available records. To have your information removed, we recommend requesting removal directly through your county’s website.
| Date | Status | Borrower | Loan Amount |
|---|---|---|---|
| Open | Chen Wei | $472,000 |
Source: Public Records
Tax History
| Year | Tax Paid | Tax Assessment Tax Assessment Total Assessment is a certain percentage of the fair market value that is determined by local assessors to be the total taxable value of land and additions on the property. | Land | Improvement |
|---|---|---|---|---|
| 2026 | $10,044 | $99,360 | $12,480 | $86,880 |
| 2025 | $9,871 | $93,600 | $12,480 | $81,120 |
| 2024 | $9,871 | $86,100 | $12,480 | $73,620 |
| 2023 | $9,544 | $95,340 | $12,480 | $82,860 |
| 2022 | $8,953 | $78,420 | $12,480 | $65,940 |
| 2021 | $9,076 | $85,980 | $12,480 | $73,500 |
| 2020 | $4,360 | $92,700 | $12,480 | $80,220 |
| 2019 | $8,568 | $82,380 | $12,480 | $69,900 |
| 2018 | $7,983 | $39,163 | $5,886 | $33,277 |
| 2017 | $7,619 | $37,374 | $5,819 | $31,555 |
| 2016 | $7,185 | $35,940 | $7,329 | $28,611 |
| 2015 | $4,252 | $34,727 | $10,243 | $24,484 |
| 2014 | $4,252 | $34,130 | $11,649 | $22,481 |
Source: Public Records
Map
Nearby Homes
Your Personal Tour Guide
Ask me questions while you tour the home.