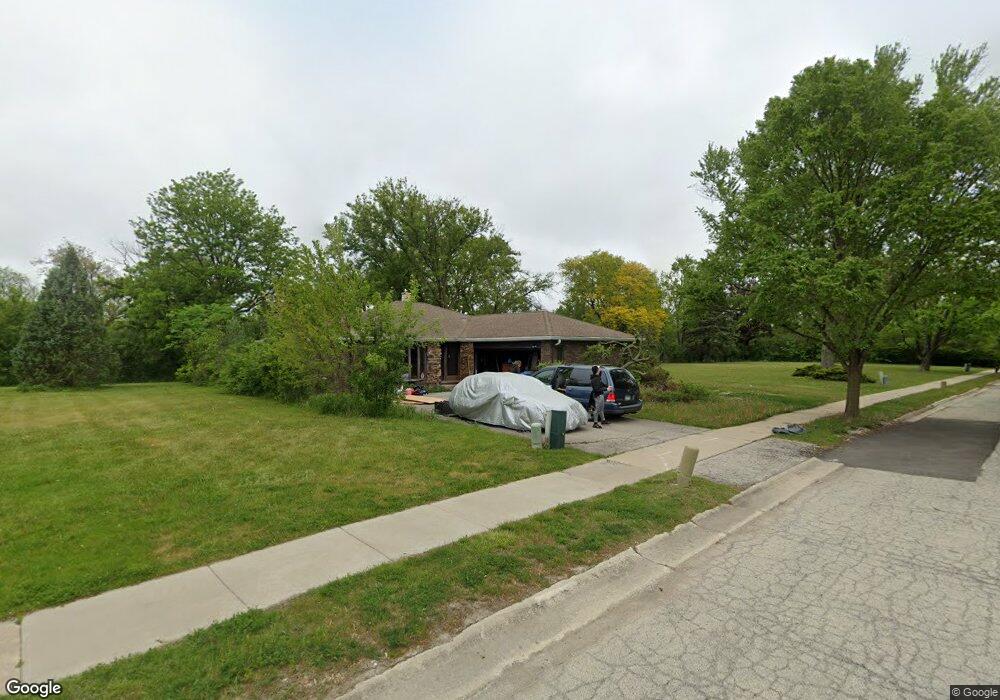
1958 Big Bend Dr Des Plaines, IL 60016
Estimated Value: $542,152
4
Beds
2
Baths
1,528
Sq Ft
$355/Sq Ft
Est. Value
About This Home
This home is located at 1958 Big Bend Dr, Des Plaines, IL 60016 and is currently estimated at $542,152, approximately $354 per square foot. 1958 Big Bend Dr is a home located in Cook County with nearby schools including North Elementary School, Chippewa Middle School, and Maine West High School.
Ownership History
Date
Name
Owned For
Owner Type
Purchase Details
Closed on
Nov 18, 2019
Sold by
City Of Des Plaines
Bought by
City Of Ndes Plaines
Current Estimated Value
Purchase Details
Closed on
Oct 31, 2018
Sold by
The City Of Des Plaines
Bought by
City Of Des Plaines
Purchase Details
Closed on
Jun 13, 2017
Sold by
Mnich Mnich Marek Marek and Mnich Sikorska
Bought by
The City Of Des Plaines
Purchase Details
Closed on
Nov 29, 2005
Sold by
Larson Chad C and Larson Catherine M
Bought by
Minich Marek and Sikorska Lucyna
Home Financials for this Owner
Home Financials are based on the most recent Mortgage that was taken out on this home.
Original Mortgage
$340,000
Interest Rate
6.34%
Mortgage Type
New Conventional
Purchase Details
Closed on
Jun 19, 1998
Sold by
Maltese Thomas E and Maltese Marilyn V
Bought by
Larson Chad C and Larson Catherine M
Home Financials for this Owner
Home Financials are based on the most recent Mortgage that was taken out on this home.
Original Mortgage
$161,250
Interest Rate
9.12%
Create a Home Valuation Report for This Property
The Home Valuation Report is an in-depth analysis detailing your home's value as well as a comparison with similar homes in the area
Home Values in the Area
Average Home Value in this Area
Purchase History
| Date | Buyer | Sale Price | Title Company |
|---|---|---|---|
| City Of Ndes Plaines | -- | Attorney | |
| City Of Des Plaines | -- | Attorney | |
| The City Of Des Plaines | -- | Chicago Title | |
| Minich Marek | $425,000 | First American Title | |
| Larson Chad C | $214,000 | -- |
Source: Public Records
Mortgage History
| Date | Status | Borrower | Loan Amount |
|---|---|---|---|
| Previous Owner | Minich Marek | $340,000 | |
| Previous Owner | Larson Chad C | $161,250 |
Source: Public Records
Tax History
| Year | Tax Paid | Tax Assessment Tax Assessment Total Assessment is a certain percentage of the fair market value that is determined by local assessors to be the total taxable value of land and additions on the property. | Land | Improvement |
|---|---|---|---|---|
| 2025 | $7,581 | -- | -- | -- |
| 2024 | $7,581 | -- | -- | -- |
| 2023 | $7,581 | -- | -- | -- |
| 2022 | $7,581 | -- | -- | -- |
| 2021 | $7,581 | $0 | $0 | $0 |
| 2020 | $7,581 | $0 | $0 | $0 |
| 2019 | $0 | $0 | $0 | $0 |
| 2018 | $0 | $0 | $0 | $0 |
| 2017 | $7,581 | $29,181 | $5,432 | $23,749 |
| 2016 | $7,415 | $29,181 | $5,432 | $23,749 |
| 2015 | $7,222 | $26,511 | $4,723 | $21,788 |
| 2014 | $7,086 | $26,511 | $4,723 | $21,788 |
| 2013 | $6,892 | $26,511 | $4,723 | $21,788 |
Source: Public Records
Map
Nearby Homes
- 183 Grove Ave Unit C
- 9456 Bay Colony Dr Unit 2N
- 9448 Bay Colony Dr Unit 3S
- 170 Grove Ave Unit B
- 9396 Bay Colony Dr Unit 1S
- 9388 Bay Colony Dr Unit 1S
- 475 Bellaire Ave
- 1569 Sherman Place
- 9387 Bay Colony Dr Unit 3W
- 609 Forest Edge Ln
- 180 Eli Ct
- 184 Eli Ct
- 180 N East River Rd
- 182 E River Rd
- 184 E River Rd
- 186 Lilah Ct
- 186 E River Rd
- 603 S River Rd Unit 2M
- 1670 Mill St Unit 207
- 659 S Des Plaines River Rd Unit 2A
- 1964 Big Bend Dr
- 1954 Big Bend Dr
- 1968 Big Bend Dr
- 1948 Big Bend Dr
- 1972 Big Bend Dr
- 1963 Big Bend Dr
- 1959 Big Bend Dr
- 1942 Big Bend Dr
- 1955 Big Bend Dr
- 1967 Big Bend Dr
- 1949 Big Bend Dr
- 1971 Big Bend Dr
- 1932 Big Bend Dr
- 1943 Big Bend Dr
- 1984 Big Bend Dr
- 1984 Big Bend Dr
- 1977 Big Bend Dr
- 1935 Big Bend Dr
- 1920 Big Bend Dr
- 1981 Big Bend Dr
Your Personal Tour Guide
Ask me questions while you tour the home.