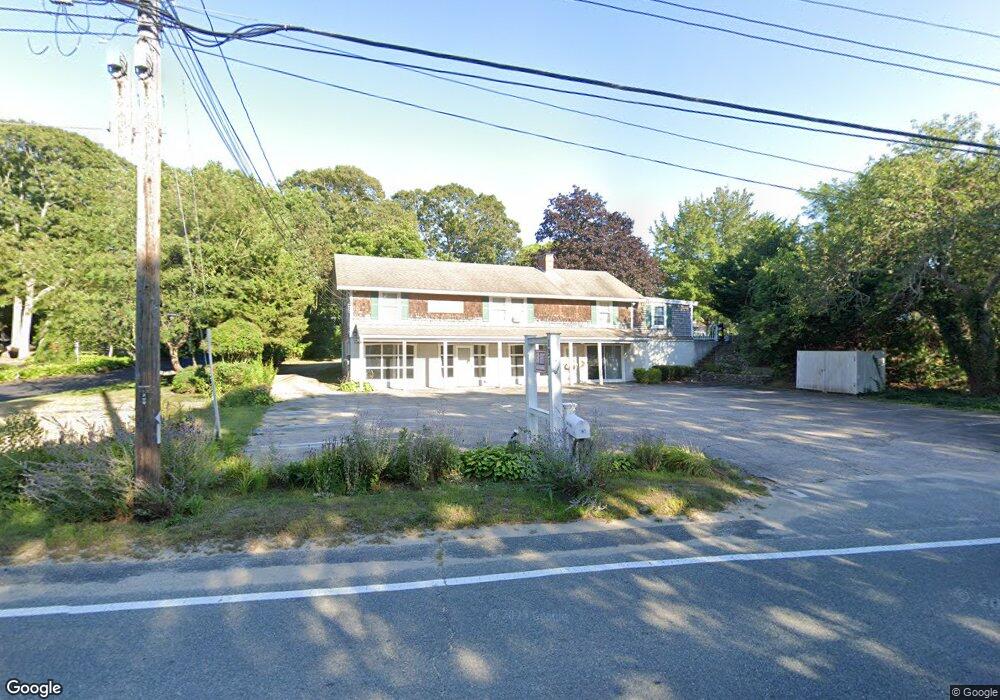
197 Main St Dennis, MA 02638
Dennis Village NeighborhoodEstimated Value: $1,017,547 - $1,252,000
4
Beds
4
Baths
3,096
Sq Ft
$358/Sq Ft
Est. Value
About This Home
This home is located at 197 Main St, Dennis, MA 02638 and is currently estimated at $1,107,849, approximately $357 per square foot. 197 Main St is a home located in Barnstable County with nearby schools including Dennis-Yarmouth Regional High School.
Ownership History
Date
Name
Owned For
Owner Type
Purchase Details
Closed on
Jun 28, 2000
Sold by
Crafts Thomas M and Ashby-Crafts Anne
Bought by
Macdonald Geraldine L
Current Estimated Value
Home Financials for this Owner
Home Financials are based on the most recent Mortgage that was taken out on this home.
Original Mortgage
$256,000
Outstanding Balance
$93,939
Interest Rate
8.59%
Mortgage Type
Purchase Money Mortgage
Estimated Equity
$1,013,910
Create a Home Valuation Report for This Property
The Home Valuation Report is an in-depth analysis detailing your home's value as well as a comparison with similar homes in the area
Home Values in the Area
Average Home Value in this Area
Purchase History
| Date | Buyer | Sale Price | Title Company |
|---|---|---|---|
| Macdonald Geraldine L | $320,000 | -- |
Source: Public Records
Mortgage History
| Date | Status | Borrower | Loan Amount |
|---|---|---|---|
| Open | Macdonald Geraldine L | $256,000 | |
| Previous Owner | Macdonald Geraldine L | $25,000 | |
| Previous Owner | Macdonald Geraldine L | $79,000 |
Source: Public Records
Tax History
| Year | Tax Paid | Tax Assessment Tax Assessment Total Assessment is a certain percentage of the fair market value that is determined by local assessors to be the total taxable value of land and additions on the property. | Land | Improvement |
|---|---|---|---|---|
| 2025 | $3,808 | $879,500 | $169,800 | $709,700 |
| 2024 | $4,006 | $912,600 | $172,400 | $740,200 |
| 2023 | $3,911 | $837,500 | $156,700 | $680,800 |
| 2022 | $3,767 | $672,600 | $156,300 | $516,300 |
| 2021 | $3,477 | $576,600 | $138,400 | $438,200 |
| 2020 | $3,262 | $534,800 | $137,600 | $397,200 |
| 2019 | $3,251 | $526,900 | $135,000 | $391,900 |
| 2018 | $2,997 | $472,700 | $128,800 | $343,900 |
| 2017 | $2,907 | $472,700 | $128,800 | $343,900 |
| 2016 | $3,064 | $469,200 | $176,700 | $292,500 |
| 2015 | $3,003 | $469,200 | $176,700 | $292,500 |
| 2014 | $2,980 | $469,300 | $156,100 | $313,200 |
Source: Public Records
Map
Nearby Homes
- 268 Main St
- 568 Route 6a
- 59 Main St Unit 19-2
- 59 Route 6a Unit 29-4
- 26 S West Dr
- 59 Massachusetts 6a Unit 19-2
- 39 Whittier Dr
- 20 Bray Farm Rd S
- 480 Main St
- 6 Thomas Ct
- 15 Signal Hill Dr
- 14 S Yarmouth Rd
- 35 Crown Grant Dr
- 15 John Hall Cartway Unit 15
- 54 Kates Path Unit 54
- 15 Musket Ln
- 645 Main St Back Lot
- 15 Jonquil Rd
- 930 Old Bass River Rd
- 3212 Heatherwood Unit 3212
Your Personal Tour Guide
Ask me questions while you tour the home.