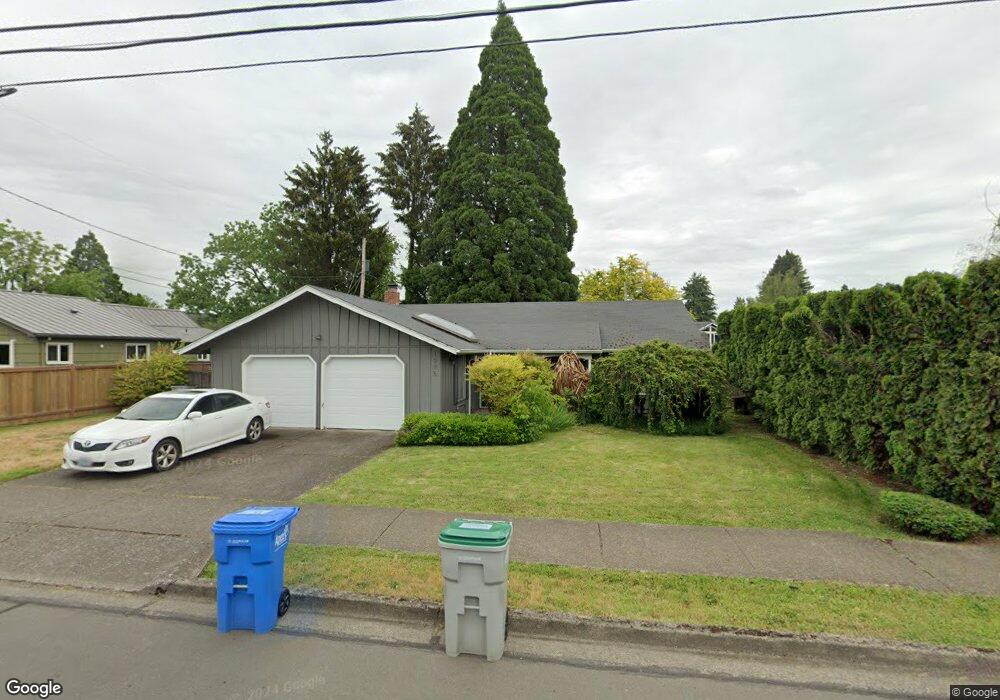
1975 Gilham Rd Eugene, OR 97401
Cal Young NeighborhoodEstimated Value: $415,000 - $440,711
3
Beds
2
Baths
1,175
Sq Ft
$365/Sq Ft
Est. Value
About This Home
This home is located at 1975 Gilham Rd, Eugene, OR 97401 and is currently estimated at $428,678, approximately $364 per square foot. 1975 Gilham Rd is a home located in Lane County with nearby schools including Willagillespie Elementary School, Monroe Middle School, and Sheldon High School.
Ownership History
Date
Name
Owned For
Owner Type
Purchase Details
Closed on
Nov 19, 2014
Sold by
Cromwell Leslie
Bought by
Ogle Robert
Current Estimated Value
Purchase Details
Closed on
Dec 11, 2006
Sold by
Hopper Moore Greg and Hopper Moore Shelli
Bought by
Cromwell Leslie
Home Financials for this Owner
Home Financials are based on the most recent Mortgage that was taken out on this home.
Original Mortgage
$46,200
Interest Rate
6.01%
Mortgage Type
Stand Alone Second
Purchase Details
Closed on
Jun 29, 2000
Sold by
Blanchard Kellee J and Blanchard Dennis L
Bought by
Hopper Moore Greg and Hopper Moore Shelli
Purchase Details
Closed on
Mar 18, 1998
Sold by
Gaine Anthony W and Markee Shannon L
Bought by
Blanchard Kellee J and Blanchard Dennis L
Home Financials for this Owner
Home Financials are based on the most recent Mortgage that was taken out on this home.
Original Mortgage
$112,628
Interest Rate
7.02%
Mortgage Type
FHA
Create a Home Valuation Report for This Property
The Home Valuation Report is an in-depth analysis detailing your home's value as well as a comparison with similar homes in the area
Home Values in the Area
Average Home Value in this Area
Purchase History
We collect this data history from publicly available records. To have your information removed, we recommend requesting removal directly through your county’s website.
| Date | Buyer | Sale Price | Title Company |
|---|---|---|---|
| Ogle Robert | $166,500 | Western Title & Escrow Co | |
| Cromwell Leslie | $231,000 | Western Title & Escrow Compa | |
| Hopper Moore Greg | $120,000 | Fidelity National Title Ins | |
| Blanchard Kellee J | $113,300 | Western Pioneer Title Co |
Source: Public Records
Mortgage History
We collect this data history from publicly available records. To have your information removed, we recommend requesting removal directly through your county’s website.
| Date | Status | Borrower | Loan Amount |
|---|---|---|---|
| Previous Owner | Cromwell Leslie | $46,200 | |
| Previous Owner | Cromwell Leslie | $184,800 | |
| Previous Owner | Blanchard Kellee J | $112,628 |
Source: Public Records
Tax History
| Year | Tax Paid | Tax Assessment Tax Assessment Total Assessment is a certain percentage of the fair market value that is determined by local assessors to be the total taxable value of land and additions on the property. | Land | Improvement |
|---|---|---|---|---|
| 2025 | $4,273 | $219,335 | -- | -- |
| 2024 | $4,220 | $212,947 | -- | -- |
| 2023 | $4,220 | $206,745 | $0 | $0 |
| 2022 | $3,954 | $200,724 | $0 | $0 |
| 2021 | $3,714 | $194,878 | $0 | $0 |
| 2020 | $3,727 | $189,202 | $0 | $0 |
| 2019 | $3,599 | $183,692 | $0 | $0 |
| 2018 | $3,388 | $173,148 | $0 | $0 |
| 2017 | $3,236 | $173,148 | $0 | $0 |
| 2016 | $3,156 | $168,105 | $0 | $0 |
| 2015 | $3,061 | $163,209 | $0 | $0 |
| 2014 | $2,931 | $158,455 | $0 | $0 |
Source: Public Records
Map
Nearby Homes
- 2146 Birchwood Ave
- 1798 Gilham Rd
- 1901 Minda Dr
- 1810 Minda Dr
- 2132 Willona Dr
- 2495 Jeppesen Acres Rd
- 2291 Norkenzie Rd
- 2624 Gilham Rd
- 1521 Gilham Rd
- 1655 Norkenzie Rd
- 2577 Elysium Ave
- 2580 Elysium Ave
- 2010 Valhalla St
- 0 Cal Young Rd Unit Lot 4
- 2578 Willona Dr
- 1490 Acacia Ave
- 2775 Elysium Ave
- 1332 Jeppesen Ave
- 2071 Musket St
- 1455 Holly Ave
- 2107 Birchwood Ave
- 2121 Birchwood Ave
- 1985 Gilham Rd
- 1991 Gilham Rd
- 0 Gilham Rd
- 2115 Birchwood Ave
- 2120 Rocky Ln
- 1980 Gilham Rd
- 1974 Gilham Rd
- 1995 Gilham Rd
- 1 Gilham
- 1972 Gilham Rd
- 2124 Rocky Ln
- 1966 Gilham Rd
- 1982 Gilham Rd
- 2110 Birchwood Ave
- 2125 Birchwood Ave
- 2116 Birchwood Ave
- 1990 Gilham Rd
- 1936 Lemming Ave
Your Personal Tour Guide
Ask me questions while you tour the home.