
Seller's Agent in 2019
Lauren Dunne
Berkshire Hathaway Home Services
(203) 209-2301
12 Total Sales
Estimated Value: $516,000 - $613,000
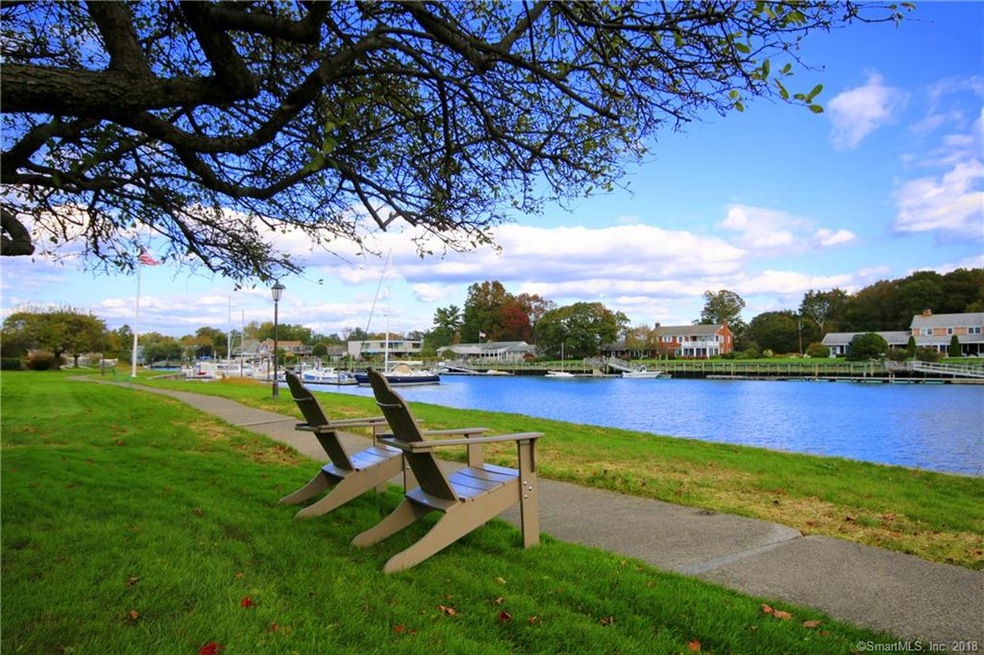
Enjoy the good life at the Dorlon Terrace Condominiums on tranquil Charles Creek, in the sought after neighborhood of Marvin Beach. You can move right in and leave your cares behind. This lovely end unit offers a wonderful floor plan. The kitchen features two entrances for a great flow that’s perfect when entertaining. Beautiful continuous granite countertops and backsplash with stainless steel appliances. Custom cabinets and shelving with a gorgeous granite counter frames one end of the living room bringing enhanced beauty and fantastic storage. The large dining room complete with built in buffet leads directly to the private patio and beautiful garden. At the top of the staircase, the owner took advantage of unused space and had a custom office nook created, with shelving. The large bathroom is completely renovated with beautiful marble and white tile and more custom cabinetry. There are two generous bedrooms upstairs with ample closet space, one features a balcony for you to enjoy early morning coffee or the cool evening breezes. This unit comes with it's own 29' boat slip which can be used by the owner or rented to other Dorlon Terrace residents. The promenade along Charles Creek creates that vacation feel all year long. Call today, you won't want this one to get away!
Last Agent to Sell the Property
Berkshire Hathaway NE Prop. License #RES.0789785 Listed on: 10/26/2018
Last Buyer's Agent
Berkshire Hathaway NE Prop. License #RES.0789785 Listed on: 10/26/2018
We collect this data history from publicly available records. To have your information removed, we recommend requesting removal directly through your county’s website.
We collect this data history from publicly available records. To have your information removed, we recommend requesting removal directly through your county’s website.
| Date | Buyer | Sale Price | Title Company |
|---|---|---|---|
| $367,000 | -- | ||
| $367,000 | -- | ||
| $335,000 | -- | ||
| $335,000 | -- | ||
| $160,000 | -- | ||
| $160,000 | -- |
We collect this data history from publicly available records. To have your information removed, we recommend requesting removal directly through your county’s website.
| Date | Status | Borrower | Loan Amount |
|---|---|---|---|
| Previous Owner | $200,900 | ||
| Previous Owner | $335,000 |
We collect this data history from publicly available records. To have your information removed, we recommend requesting removal directly through your county’s website.
| Date | Event | Price | List to Sale | Price per Sq Ft |
|---|---|---|---|---|
| 01/25/2019 01/25/19 | Sold | $367,000 | -2.1% | $319 / Sq Ft |
| 12/04/2018 12/04/18 | Price Changed | $375,000 | -2.6% | $326 / Sq Ft |
| 10/26/2018 10/26/18 | For Sale | $385,000 | -- | $335 / Sq Ft |
We collect this data history from publicly available records. To have your information removed, we recommend requesting removal directly through your county’s website.
| Year | Tax Paid | Tax Assessment Tax Assessment Total Assessment is a certain percentage of the fair market value that is determined by local assessors to be the total taxable value of land and additions on the property. | Land | Improvement |
|---|---|---|---|---|
| 2025 | $6,950 | $293,340 | $0 | $293,340 |
| 2024 | $6,843 | $293,340 | $0 | $293,340 |
| 2023 | $5,872 | $235,930 | $0 | $235,930 |
| 2022 | $5,763 | $235,930 | $0 | $235,930 |
| 2021 | $5,552 | $235,930 | $0 | $235,930 |
| 2020 | $5,550 | $235,930 | $0 | $235,930 |
| 2019 | $5,487 | $235,930 | $0 | $235,930 |
| 2018 | $4,622 | $178,650 | $0 | $178,650 |
| 2017 | $4,471 | $178,650 | $0 | $178,650 |
| 2016 | $4,545 | $178,650 | $0 | $178,650 |
Seller's Agent in 2019
Lauren Dunne
Berkshire Hathaway Home Services
(203) 209-2301
12 Total Sales
Source: SmartMLS
MLS Number: 170138834
APN: NORW M:3 B:74 L:1-H-04
Disclaimer: Certain information contained herein is derived from information provided by parties other than Homes.com. All information provided is deemed reliable, but is not guaranteed to be accurate and should be independently verified.
![]() IDX information is provided exclusively for personal, non-commercial use, and may not be used for any purpose other than to identify prospective properties consumers may be interested in purchasing. Information is deemed reliable but not guaranteed.
IDX information is provided exclusively for personal, non-commercial use, and may not be used for any purpose other than to identify prospective properties consumers may be interested in purchasing. Information is deemed reliable but not guaranteed.
Ask me questions while you tour the home.