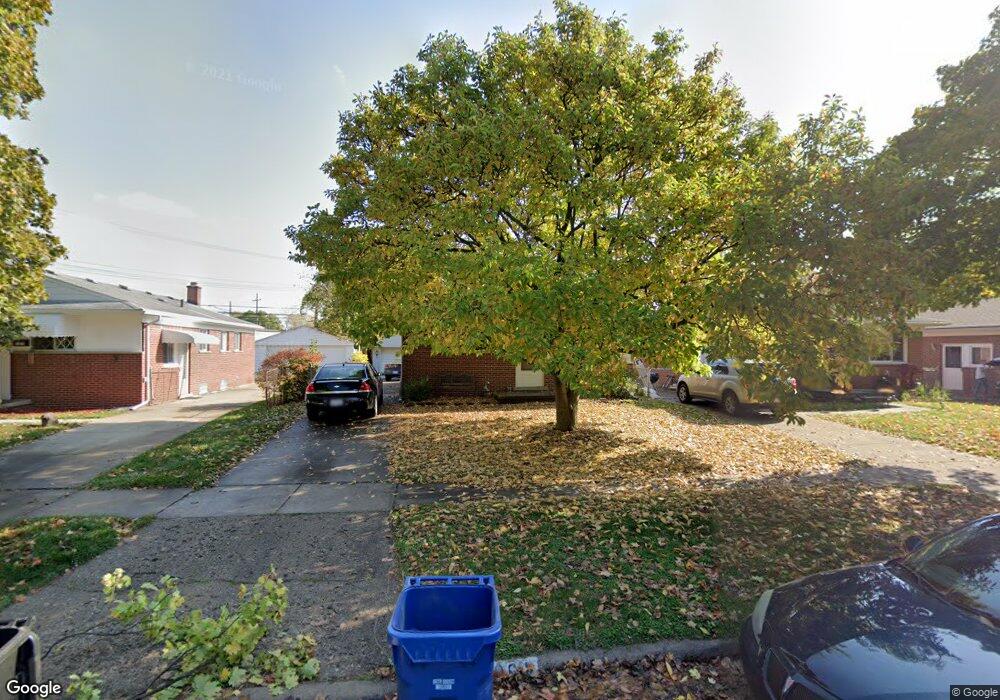
19964 Fox Redford, MI 48240
Estimated Value: $135,817 - $160,000
Studio
1
Bath
954
Sq Ft
$157/Sq Ft
Est. Value
About This Home
This home is located at 19964 Fox, Redford, MI 48240 and is currently estimated at $149,454, approximately $156 per square foot. 19964 Fox is a home located in Wayne County with nearby schools including Beech Elementary School, Hilbert Elementary School, and David Ellis Academy West.
Ownership History
Date
Name
Owned For
Owner Type
Purchase Details
Closed on
Nov 24, 2019
Sold by
Halstead Thomas E and Halstead Julie
Bought by
Halstead Thomas E
Current Estimated Value
Home Financials for this Owner
Home Financials are based on the most recent Mortgage that was taken out on this home.
Original Mortgage
$72,547
Outstanding Balance
$63,848
Interest Rate
3.62%
Mortgage Type
FHA
Estimated Equity
$85,606
Purchase Details
Closed on
Sep 26, 2006
Sold by
Grahl Timothy M and Grahl Nancy Jean
Bought by
Halstead Ii Thomas E
Create a Home Valuation Report for This Property
The Home Valuation Report is an in-depth analysis detailing your home's value as well as a comparison with similar homes in the area
Home Values in the Area
Average Home Value in this Area
Purchase History
| Date | Buyer | Sale Price | Title Company |
|---|---|---|---|
| Halstead Thomas E | -- | None Available | |
| Halstead Ii Thomas E | $90,000 | Title Source Inc |
Source: Public Records
Mortgage History
| Date | Status | Borrower | Loan Amount |
|---|---|---|---|
| Open | Halstead Thomas E | $72,547 |
Source: Public Records
Tax History
| Year | Tax Paid | Tax Assessment Tax Assessment Total Assessment is a certain percentage of the fair market value that is determined by local assessors to be the total taxable value of land and additions on the property. | Land | Improvement |
|---|---|---|---|---|
| 2025 | $699 | $70,200 | $0 | $0 |
| 2024 | $680 | $67,600 | $0 | $0 |
| 2023 | $648 | $53,700 | $0 | $0 |
| 2022 | $1,650 | $45,900 | $0 | $0 |
| 2021 | $1,604 | $42,500 | $0 | $0 |
| 2020 | $1,583 | $35,000 | $0 | $0 |
| 2019 | $1,549 | $31,700 | $0 | $0 |
| 2018 | $584 | $25,000 | $0 | $0 |
| 2017 | $2,113 | $22,900 | $0 | $0 |
| 2016 | $1,633 | $21,500 | $0 | $0 |
| 2015 | $2,100 | $21,000 | $0 | $0 |
| 2013 | $2,090 | $21,300 | $0 | $0 |
| 2012 | $1,510 | $25,400 | $6,200 | $19,200 |
Source: Public Records
Map
Nearby Homes
- 19930 Gaylord
- 19925 Negaunee
- 20019 Macarthur
- 19968 Poinciana
- 19495 Lexington
- 19816 Poinciana
- 19941 Woodworth
- 20005 Woodworth
- 19910 Seminole
- 19498 Poinciana
- 19430 Lexington
- 19470 Woodworth
- 19953 Wakenden
- 19224 Denby
- 19461 Inkster Rd
- 19450 Rensellor St
- 19205 Wakenden
- 20503 Centralia
- 26415 W 7 Mile Rd Unit C218
- 27725 Norfolk St
Your Personal Tour Guide
Ask me questions while you tour the home.