Estimated Value: $442,983 - $570,000
Studio
2
Baths
903
Sq Ft
$542/Sq Ft
Est. Value
About This Home
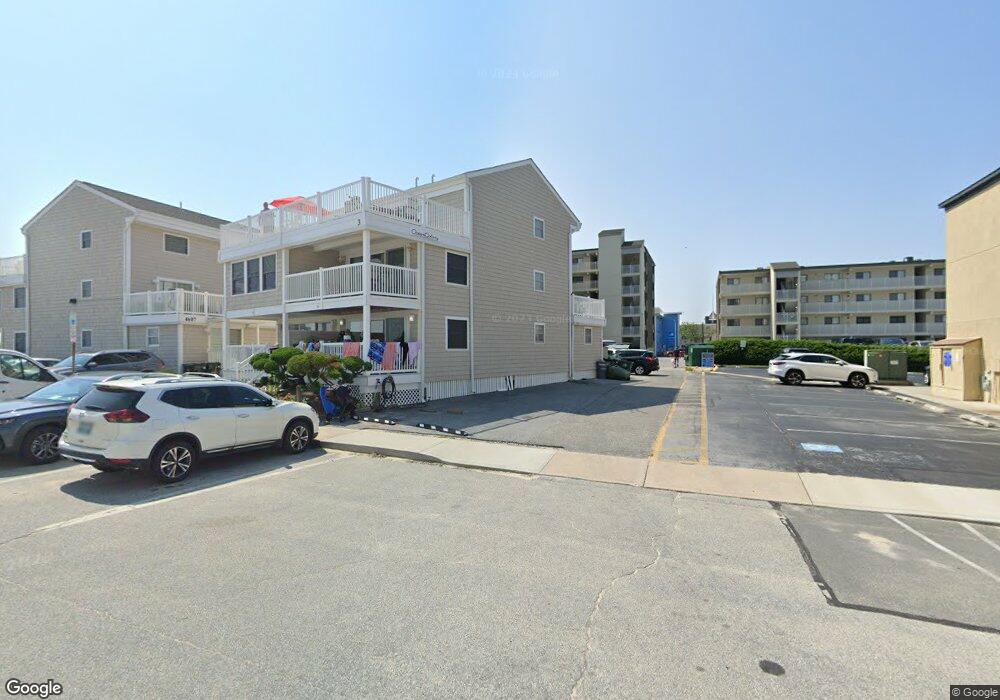
This home is located at 2 46th St, Ocean City, MD 21842 and is currently estimated at $488,996, approximately $541 per square foot. 2 46th St is a home located in Worcester County with nearby schools including Ocean City Elementary School, Stephen Decatur Middle School, and Berlin Intermediate School.
Ownership History
Date
Name
Owned For
Owner Type
Purchase Details
Closed on
Jun 29, 2005
Sold by
Chavez Joseph J and Marie Anne
Bought by
Howard Bedford
Current Estimated Value
Purchase Details
Closed on
May 21, 1997
Sold by
Peter Goch and Peter Karen E
Bought by
Chavez Joseph J and Marie Anne
Purchase Details
Closed on
Nov 26, 1985
Sold by
Beach Builders Limited Inc
Bought by
Goch Peter and Goch Karen E
Home Financials for this Owner
Home Financials are based on the most recent Mortgage that was taken out on this home.
Original Mortgage
$110,700
Interest Rate
11.64%
Create a Home Valuation Report for This Property
The Home Valuation Report is an in-depth analysis detailing your home's value as well as a comparison with similar homes in the area
Home Values in the Area
Average Home Value in this Area
Purchase History
| Date | Buyer | Sale Price | Title Company |
|---|---|---|---|
| Howard Bedford | $438,500 | -- | |
| Chavez Joseph J | $123,500 | -- | |
| Goch Peter | $123,000 | -- |
Source: Public Records
Mortgage History
| Date | Status | Borrower | Loan Amount |
|---|---|---|---|
| Previous Owner | Goch Peter | $110,700 | |
| Closed | Chavez Joseph J | -- |
Source: Public Records
Tax History
| Year | Tax Paid | Tax Assessment Tax Assessment Total Assessment is a certain percentage of the fair market value that is determined by local assessors to be the total taxable value of land and additions on the property. | Land | Improvement |
|---|---|---|---|---|
| 2025 | $4,442 | $325,333 | $0 | $0 |
| 2024 | $4,166 | $298,567 | $0 | $0 |
| 2023 | $3,820 | $271,800 | $190,200 | $81,600 |
| 2022 | $3,820 | $271,800 | $190,200 | $81,600 |
| 2021 | $3,841 | $271,800 | $190,200 | $81,600 |
| 2020 | $3,840 | $271,800 | $190,200 | $81,600 |
| 2019 | $3,781 | $265,767 | $0 | $0 |
| 2018 | $3,658 | $259,733 | $0 | $0 |
| 2017 | $3,584 | $253,700 | $0 | $0 |
| 2016 | -- | $253,700 | $0 | $0 |
| 2015 | $4,226 | $253,700 | $0 | $0 |
| 2014 | $4,226 | $279,900 | $0 | $0 |
Source: Public Records
About Salty Sands East and West Building
Map
Nearby Homes
- 4 46th St Unit 307
- 9 46th St Unit 22
- 4503 Atlantic Ave Unit 200
- 14 45th St Unit 403
- 12 45th St Unit 102
- 4500 Coastal Hwy Unit 305
- 4500 Coastal Hwy Unit 407
- 4607 Atlantic Ave Unit 31
- 4601B Coastal Hwy Unit 501
- 4601B Coastal Hwy Unit 403
- 4601B Coastal Hwy Unit 503
- 2 48th St Unit 212
- 2 48th St Unit 214
- 2 48th St Unit 304
- 2 48th St Unit 1402
- 2 48th St Unit 1612
- 2 48th St Unit 402
- 2 48th St Unit 1602
- 13 44th St Unit 106
- 4711 Coastal Hwy Unit 436
Your Personal Tour Guide
Ask me questions while you tour the home.