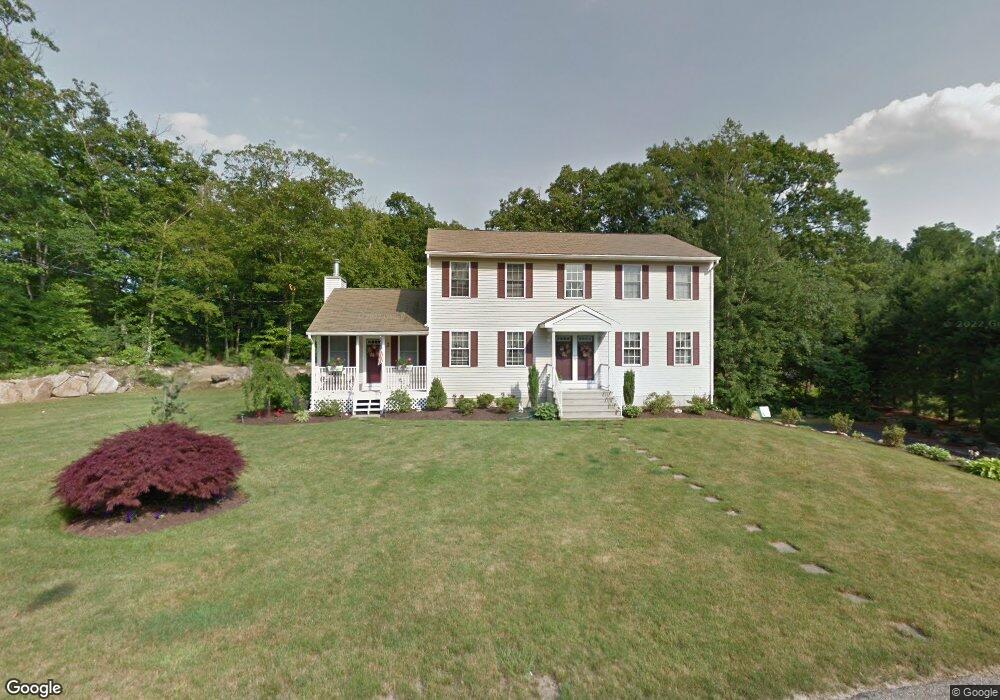
2 Apple Blossom Dr Johnston, RI 02919
Greenville Avenue NeighborhoodEstimated Value: $672,668 - $749,000
3
Beds
3
Baths
2,600
Sq Ft
$273/Sq Ft
Est. Value
About This Home
This home is located at 2 Apple Blossom Dr, Johnston, RI 02919 and is currently estimated at $709,667, approximately $272 per square foot. 2 Apple Blossom Dr is a home located in Providence County with nearby schools including Johnston Senior High School, Saint Philip School, and Overbrook Academy.
Ownership History
Date
Name
Owned For
Owner Type
Purchase Details
Closed on
Jul 30, 2009
Sold by
Watterson Paul F and Watterson Barbara
Bought by
Casey Patrick A and Tammelleo-Casey Lisa M
Current Estimated Value
Purchase Details
Closed on
Aug 29, 2001
Sold by
Page Kenneth A and Page Dina A
Bought by
Watterson Paul F and Watterson Barbara A
Purchase Details
Closed on
May 19, 2000
Sold by
Johnson Arthur R
Bought by
Page Kenneth A and Page Dina A
Create a Home Valuation Report for This Property
The Home Valuation Report is an in-depth analysis detailing your home's value as well as a comparison with similar homes in the area
Home Values in the Area
Average Home Value in this Area
Purchase History
| Date | Buyer | Sale Price | Title Company |
|---|---|---|---|
| Casey Patrick A | $379,900 | -- | |
| Watterson Paul F | $280,000 | -- | |
| Page Kenneth A | $235,000 | -- |
Source: Public Records
Mortgage History
| Date | Status | Borrower | Loan Amount |
|---|---|---|---|
| Open | Page Kenneth A | $38,125 | |
| Open | Page Kenneth A | $299,000 | |
| Closed | Page Kenneth A | $150,000 |
Source: Public Records
Tax History
| Year | Tax Paid | Tax Assessment Tax Assessment Total Assessment is a certain percentage of the fair market value that is determined by local assessors to be the total taxable value of land and additions on the property. | Land | Improvement |
|---|---|---|---|---|
| 2025 | $8,129 | $520,400 | $125,500 | $394,900 |
| 2024 | $7,962 | $520,400 | $125,500 | $394,900 |
| 2023 | $7,962 | $520,400 | $125,500 | $394,900 |
| 2022 | $6,591 | $354,500 | $102,500 | $252,000 |
| 2021 | $8,239 | $354,500 | $102,500 | $252,000 |
| 2018 | $9,033 | $328,600 | $94,400 | $234,200 |
| 2016 | $11,951 | $328,600 | $94,400 | $234,200 |
| 2015 | $8,804 | $303,700 | $91,500 | $212,200 |
| 2014 | $6,985 | $303,700 | $91,500 | $212,200 |
| 2013 | $8,731 | $303,700 | $91,500 | $212,200 |
Source: Public Records
Map
Nearby Homes
- 7 Sydney Rose Ct
- 0 Buona Vista Ave Unit 1329320
- 0 Belfield Lot#2 Dr Unit 1337597
- 6 Heywood Ln
- 42 Belfield Dr
- 29 Golini Dr
- 25 Belfield Dr
- 18 Carriage Way
- 26 Kensington Way
- 19 Hilton Dr
- 74 Anglewood Ave
- 4 Arcade St
- 7 Belvedere St
- 3 Belfield Dr Unit 1337601
- 4 Belfield Dr Unit 1337603
- 9 Finne Rd
- 9 Anglewood Ave
- 0 Anglewood Ave
- 2207 Hartford Ave
- 4 Upper Farm Way
- 3 Apple Blossom Dr
- 4 Apple Blossom Dr
- 15 Poppy Hill Dr
- 9 Poppy Hill Dr
- 6 Apple Blossom Dr
- 16 Poppy Hill Dr
- 1 Apple Blossom Dr
- 33 Apple Blossom Dr
- 18 Poppy Hill Dr
- 5 Apple Blossom Dr
- 14 Poppy Hill Dr
- 17 Poppy Hill Dr
- 20 Poppy Hill Dr
- 2 Tulip Hill Dr
- 8 Apple Blossom Dr
- 7 Peach Tree Rd
- 9 Apple Blossom Dr
- 7 Poppy Hill Dr
- 22 Poppy Hill Dr
- 12 Poppy Hill Dr
Your Personal Tour Guide
Ask me questions while you tour the home.