2 Evans St Cumberland, RI 02864
North Cumberland NeighborhoodEstimated Value: $936,664 - $1,098,000
About This Home
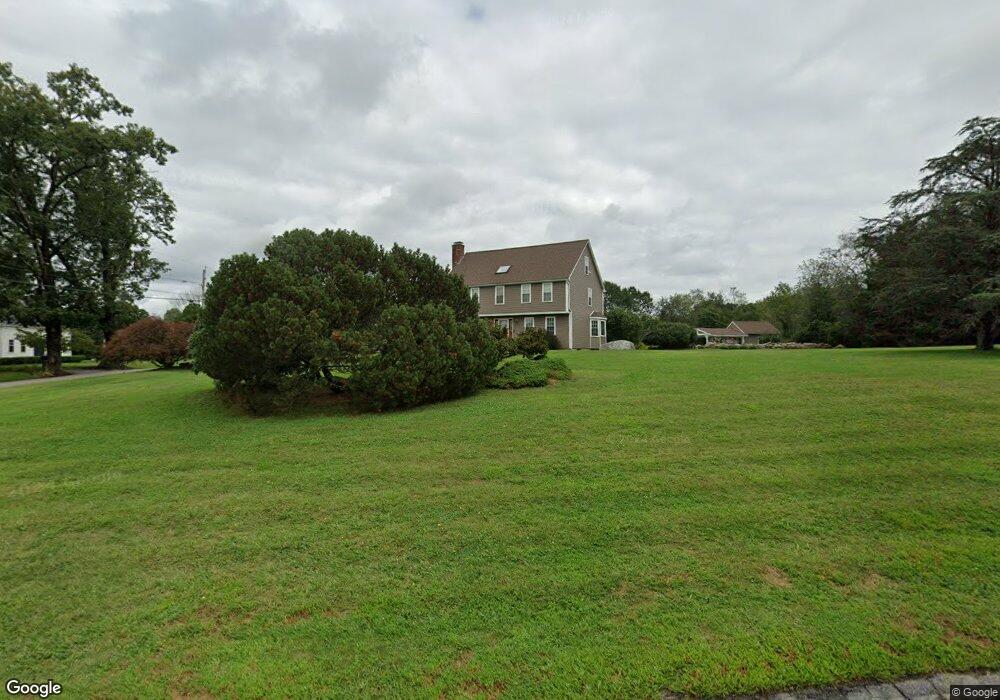
This home is located at 2 Evans St, Cumberland, RI 02864 and is currently estimated at $1,012,166, approximately $375 per square foot. 2 Evans St is a home located in Providence County with nearby schools including Community School, North Cumberland Middle School, and Cumberland High School.
Ownership History
We collect this data history from publicly available records. To have your information removed, we recommend requesting removal directly through your county’s website.
Purchase Details
Purchase Details
Home Values in the Area
Average Home Value in this Area
Purchase History
We collect this data history from publicly available records. To have your information removed, we recommend requesting removal directly through your county’s website.
| Date | Buyer | Sale Price | Title Company |
|---|---|---|---|
| -- | None Available | ||
| $385,000 | -- |
Mortgage History
We collect this data history from publicly available records. To have your information removed, we recommend requesting removal directly through your county’s website.
| Date | Status | Borrower | Loan Amount |
|---|---|---|---|
| Previous Owner | $246,000 | ||
| Closed | $80,000 | ||
| Closed | $240,000 | ||
| Previous Owner | $32,500 | ||
| Closed | $16,563 | ||
| Closed | $200,000 | ||
| Previous Owner | $200,000 | ||
| Previous Owner | $196,500 |
Tax History
We collect this data history from publicly available records. To have your information removed, we recommend requesting removal directly through your county’s website.
| Year | Tax Paid | Tax Assessment Tax Assessment Total Assessment is a certain percentage of the fair market value that is determined by local assessors to be the total taxable value of land and additions on the property. | Land | Improvement |
|---|---|---|---|---|
| 2025 | $8,427 | $686,800 | $223,400 | $463,400 |
| 2024 | $8,207 | $686,800 | $223,400 | $463,400 |
| 2023 | $7,981 | $686,800 | $223,400 | $463,400 |
| 2022 | $7,658 | $510,900 | $160,900 | $350,000 |
| 2021 | $7,531 | $510,900 | $160,900 | $350,000 |
| 2020 | $7,316 | $510,900 | $160,900 | $350,000 |
| 2019 | $7,179 | $452,100 | $148,100 | $304,000 |
| 2018 | $6,971 | $452,100 | $148,100 | $304,000 |
| 2017 | $6,876 | $452,100 | $148,100 | $304,000 |
| 2016 | $7,172 | $419,900 | $140,400 | $279,500 |
| 2015 | $7,172 | $419,900 | $140,400 | $279,500 |
| 2014 | $6,824 | $419,900 | $140,400 | $279,500 |
| 2013 | $6,841 | $433,500 | $143,200 | $290,300 |
Map
- 24 Rhodes St
- 13 Paddock Dr
- lot 11 Field Cir
- 20 Peggy Dr
- 376 Hancock St
- 19 Chestnut St
- 19 Chestnut St - Lot 1
- 19 Chestnut St - Lot 3
- 19 Chestnut St - Lot 2
- 80 Fisher Rd Unit 77
- 80 Fisher Rd Unit 73
- 80 Fisher Rd Unit 97
- 2 Field Dr
- 42 Georgiana Dr
- 22 Rhodes Dr
- 3980 Diamond Hill Rd Unit 4
- 3870 Diamond Hill Rd
- 657 High St
- 15 Austin Dr
- 18 Manchester Dr
Ask me questions while you tour the home.