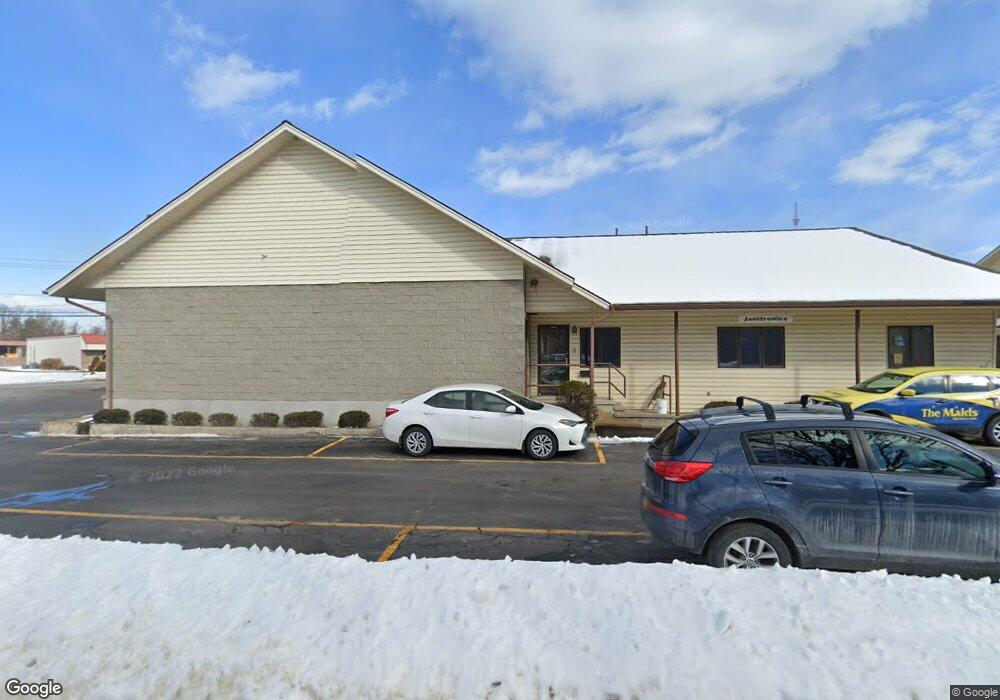
2 Glens Falls Tech Park Glens Falls, NY 12801
Estimated Value: $496,386
Studio
2
Baths
2,400
Sq Ft
$207/Sq Ft
Est. Value
About This Home
This home is located at 2 Glens Falls Tech Park, Glens Falls, NY 12801 and is currently priced at $496,386, approximately $206 per square foot. 2 Glens Falls Tech Park is a home located in Warren County with nearby schools including Abraham Wing School, St. Mary's - St. Alphonsus Regional Catholic School, and Greater Glens Falls Christian Academy.
Ownership History
Date
Name
Owned For
Owner Type
Purchase Details
Closed on
Jan 27, 2026
Sold by
B & C Llc
Bought by
Black Nest Assets Llc
Current Estimated Value
Home Financials for this Owner
Home Financials are based on the most recent Mortgage that was taken out on this home.
Original Mortgage
$252,500
Outstanding Balance
$252,500
Interest Rate
6.21%
Mortgage Type
Purchase Money Mortgage
Estimated Equity
$243,886
Create a Home Valuation Report for This Property
The Home Valuation Report is an in-depth analysis detailing your home's value as well as a comparison with similar homes in the area
Home Values in the Area
Average Home Value in this Area
Purchase History
| Date | Buyer | Sale Price | Title Company |
|---|---|---|---|
| Black Nest Assets Llc | $495,000 | -- |
Source: Public Records
Mortgage History
| Date | Status | Borrower | Loan Amount |
|---|---|---|---|
| Open | Black Nest Assets Llc | $252,500 |
Source: Public Records
Tax History
| Year | Tax Paid | Tax Assessment Tax Assessment Total Assessment is a certain percentage of the fair market value that is determined by local assessors to be the total taxable value of land and additions on the property. | Land | Improvement |
|---|---|---|---|---|
| 2024 | $7,846 | $315,200 | $96,300 | $218,900 |
| 2023 | $8,038 | $315,200 | $96,300 | $218,900 |
| 2022 | $8,581 | $315,200 | $96,300 | $218,900 |
| 2021 | $9,009 | $231,400 | $19,100 | $212,300 |
| 2020 | $8,940 | $231,400 | $19,100 | $212,300 |
| 2019 | $9,848 | $231,400 | $19,100 | $212,300 |
| 2018 | $4,271 | $231,400 | $19,100 | $212,300 |
| 2017 | $4,190 | $231,400 | $19,100 | $212,300 |
| 2016 | $8,388 | $231,400 | $19,100 | $212,300 |
| 2015 | -- | $231,400 | $19,100 | $212,300 |
| 2014 | -- | $231,400 | $19,100 | $212,300 |
Source: Public Records
Map
Nearby Homes
Your Personal Tour Guide
Ask me questions while you tour the home.