Estimated Value: $962,000 - $1,294,000
2
Beds
3
Baths
2,200
Sq Ft
$529/Sq Ft
Est. Value
About This Home
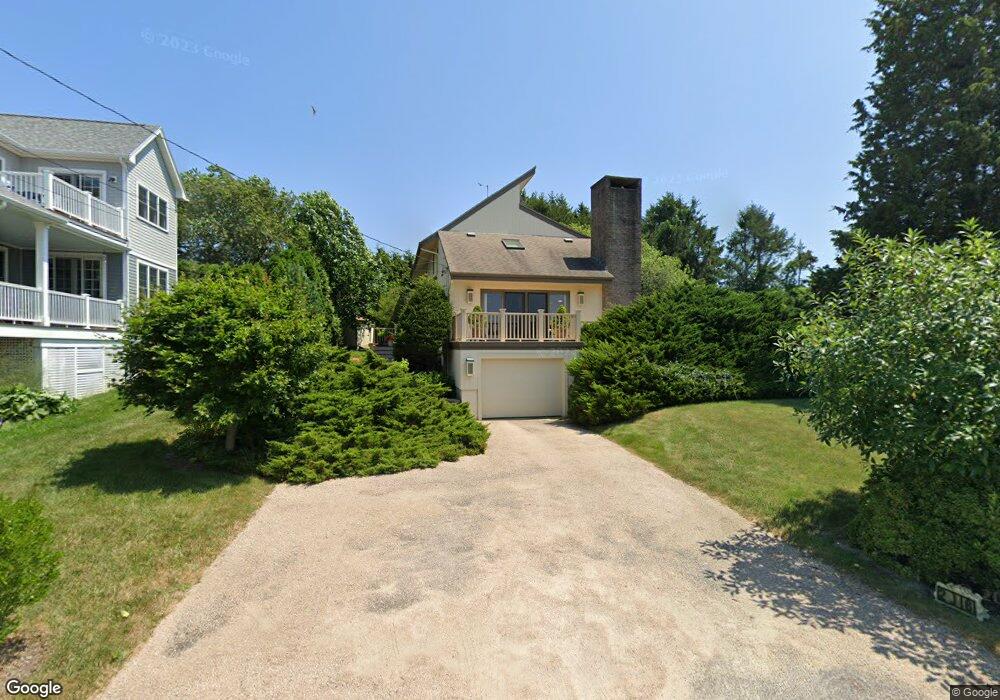
This home is located at 2 Jib St, Jamestown, RI 02835 and is currently estimated at $1,162,813, approximately $528 per square foot. 2 Jib St is a home located in Newport County with nearby schools including Melrose Avenue School and Lawn Avenue School.
Ownership History
Date
Name
Owned For
Owner Type
Purchase Details
Closed on
Jun 15, 2005
Sold by
Frazier Jane C
Bought by
Kopelcheck William A and Kopelcheck Joanne P
Current Estimated Value
Home Financials for this Owner
Home Financials are based on the most recent Mortgage that was taken out on this home.
Original Mortgage
$187,000
Outstanding Balance
$97,751
Interest Rate
5.78%
Mortgage Type
Purchase Money Mortgage
Estimated Equity
$1,065,062
Purchase Details
Closed on
Apr 21, 2004
Sold by
Cranston Jane Ann
Bought by
Armington Carolyn
Create a Home Valuation Report for This Property
The Home Valuation Report is an in-depth analysis detailing your home's value as well as a comparison with similar homes in the area
Home Values in the Area
Average Home Value in this Area
Purchase History
We collect this data history from publicly available records. To have your information removed, we recommend requesting removal directly through your county’s website.
| Date | Buyer | Sale Price | Title Company |
|---|---|---|---|
| Kopelcheck William A | $220,000 | -- | |
| Armington Carolyn | $795,000 | -- |
Source: Public Records
Mortgage History
We collect this data history from publicly available records. To have your information removed, we recommend requesting removal directly through your county’s website.
| Date | Status | Borrower | Loan Amount |
|---|---|---|---|
| Open | Armington Carolyn | $187,000 |
Source: Public Records
Tax History
| Year | Tax Paid | Tax Assessment Tax Assessment Total Assessment is a certain percentage of the fair market value that is determined by local assessors to be the total taxable value of land and additions on the property. | Land | Improvement |
|---|---|---|---|---|
| 2025 | $4,737 | $839,900 | $224,200 | $615,700 |
| 2024 | $4,223 | $589,000 | $169,700 | $419,300 |
| 2023 | $4,111 | $589,000 | $169,700 | $419,300 |
| 2022 | $3,999 | $589,000 | $169,700 | $419,300 |
| 2021 | $5,011 | $605,200 | $183,100 | $422,100 |
| 2020 | $4,880 | $604,700 | $183,100 | $421,600 |
| 2019 | $4,868 | $604,700 | $183,100 | $421,600 |
| 2018 | $4,783 | $540,400 | $162,900 | $377,500 |
| 2017 | $4,680 | $540,400 | $162,900 | $377,500 |
| 2016 | $4,637 | $540,400 | $162,900 | $377,500 |
| 2015 | $4,487 | $511,000 | $190,400 | $320,600 |
| 2014 | $4,471 | $511,000 | $190,400 | $320,600 |
Source: Public Records
Map
Nearby Homes
- 121 Seaside Dr
- 94 Spindrift St
- 0 N Main Rd
- 13 Starboard Ave
- 63 Buoy St
- 14 Hulls Ct
- 10 Coulter St
- 5 Decatur Ave
- 30 W Bay View Dr
- 503 Seaside Dr
- 18 Lugger St
- 400 Schooner Ave
- 47 North Rd
- 46 North Rd
- 109 Umiak Ave
- 65 Coronado St
- 585 Seaside Dr
- 22 Spindrift Dr
- 150 Bay View Dr Unit 14
- 150 Bay View Dr Unit 8
Your Personal Tour Guide
Ask me questions while you tour the home.