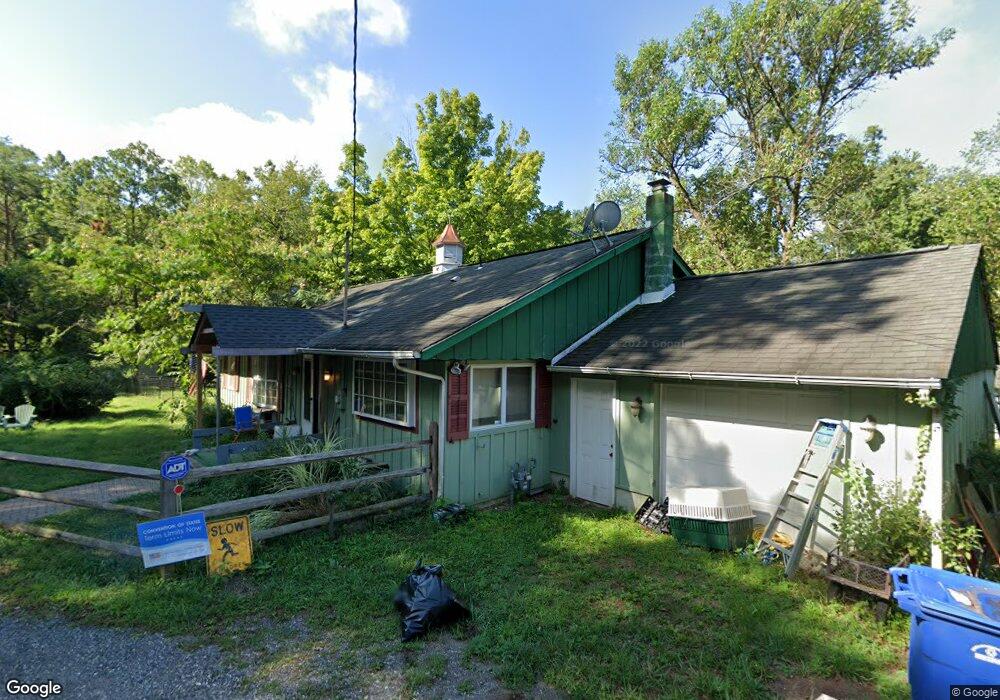
2 Kates Tract Mount Holly, NJ 08060
Estimated Value: $249,000 - $401,000
2
Beds
1
Bath
1,408
Sq Ft
$220/Sq Ft
Est. Value
About This Home
This home is located at 2 Kates Tract, Mount Holly, NJ 08060 and is currently estimated at $309,480, approximately $219 per square foot. 2 Kates Tract is a home located in Burlington County with nearby schools including John Brainerd Elementary School, Folwell Elementary School, and F.W. Holbein School.
Ownership History
Date
Name
Owned For
Owner Type
Purchase Details
Closed on
Jun 28, 2005
Sold by
Glazier John R and Waleski Susan
Bought by
Neergaard William S and Neergaard Susan J
Current Estimated Value
Home Financials for this Owner
Home Financials are based on the most recent Mortgage that was taken out on this home.
Original Mortgage
$124,000
Outstanding Balance
$62,695
Interest Rate
5.67%
Mortgage Type
Stand Alone First
Estimated Equity
$246,785
Purchase Details
Closed on
Mar 28, 2001
Sold by
Glazier Helen S and Glazier John R
Bought by
Glazier John R
Create a Home Valuation Report for This Property
The Home Valuation Report is an in-depth analysis detailing your home's value as well as a comparison with similar homes in the area
Home Values in the Area
Average Home Value in this Area
Purchase History
| Date | Buyer | Sale Price | Title Company |
|---|---|---|---|
| Neergaard William S | $155,000 | Weichert Title Agency | |
| Glazier John R | -- | -- |
Source: Public Records
Mortgage History
| Date | Status | Borrower | Loan Amount |
|---|---|---|---|
| Open | Neergaard William S | $124,000 |
Source: Public Records
Tax History
| Year | Tax Paid | Tax Assessment Tax Assessment Total Assessment is a certain percentage of the fair market value that is determined by local assessors to be the total taxable value of land and additions on the property. | Land | Improvement |
|---|---|---|---|---|
| 2025 | $5,523 | $157,300 | $75,600 | $81,700 |
| 2024 | $5,279 | $157,300 | $75,600 | $81,700 |
| 2023 | $5,279 | $157,300 | $75,600 | $81,700 |
| 2022 | $5,093 | $157,300 | $75,600 | $81,700 |
| 2021 | $5,010 | $157,300 | $75,600 | $81,700 |
| 2020 | $4,815 | $157,300 | $75,600 | $81,700 |
| 2019 | $4,706 | $157,300 | $75,600 | $81,700 |
| 2018 | $4,623 | $157,300 | $75,600 | $81,700 |
| 2017 | $4,504 | $157,300 | $75,600 | $81,700 |
| 2016 | $4,400 | $157,300 | $75,600 | $81,700 |
| 2015 | $4,307 | $157,300 | $75,600 | $81,700 |
| 2014 | $4,148 | $157,300 | $75,600 | $81,700 |
Source: Public Records
Map
Nearby Homes
Your Personal Tour Guide
Ask me questions while you tour the home.