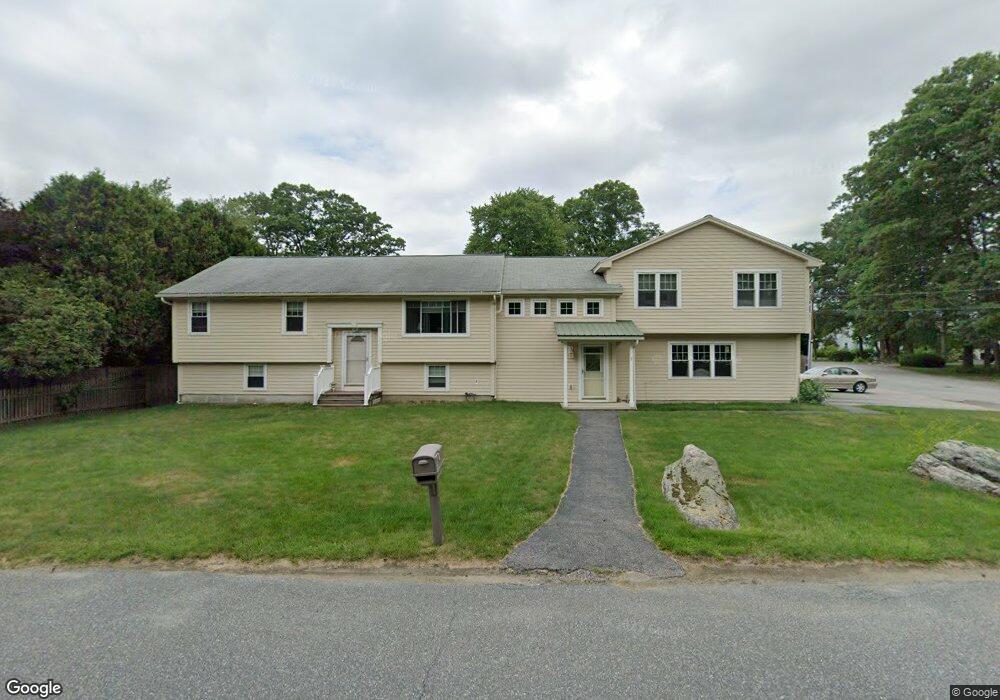
2 Matson Ln Millbury, MA 01527
Estimated Value: $596,000 - $756,000
About This Home
This home is located at 2 Matson Ln, Millbury, MA 01527 and is currently estimated at $659,435, approximately $267 per square foot. 2 Matson Ln is a home located in Worcester County with nearby schools including Elmwood Street Elementary School, Raymond E. Shaw Elementary School, and Millbury Junior/Senior High School.
Ownership History
We collect this data history from publicly available records. To have your information removed, we recommend requesting removal directly through your county’s website.
Purchase Details
Purchase Details
Home Values in the Area
Average Home Value in this Area
Purchase History
We collect this data history from publicly available records. To have your information removed, we recommend requesting removal directly through your county’s website.
| Date | Buyer | Sale Price | Title Company |
|---|---|---|---|
| -- | None Available | ||
| -- | None Available | ||
| -- | None Available | ||
| -- | None Available | ||
| -- | -- | ||
| -- | -- |
Mortgage History
We collect this data history from publicly available records. To have your information removed, we recommend requesting removal directly through your county’s website.
| Date | Status | Borrower | Loan Amount |
|---|---|---|---|
| Previous Owner | $25,000 |
Tax History
We collect this data history from publicly available records. To have your information removed, we recommend requesting removal directly through your county’s website.
| Year | Tax Paid | Tax Assessment Tax Assessment Total Assessment is a certain percentage of the fair market value that is determined by local assessors to be the total taxable value of land and additions on the property. | Land | Improvement |
|---|---|---|---|---|
| 2025 | $8,611 | $643,100 | $107,900 | $535,200 |
| 2024 | $7,901 | $597,200 | $99,900 | $497,300 |
| 2023 | $7,192 | $497,700 | $70,100 | $427,600 |
| 2022 | $6,626 | $441,700 | $70,100 | $371,600 |
| 2021 | $6,479 | $419,900 | $70,100 | $349,800 |
| 2020 | $6,676 | $435,500 | $70,100 | $365,400 |
| 2019 | $5,695 | $359,300 | $63,700 | $295,600 |
| 2018 | $5,593 | $342,300 | $63,700 | $278,600 |
| 2017 | $4,987 | $303,500 | $63,700 | $239,800 |
| 2016 | $4,836 | $293,800 | $63,700 | $230,100 |
| 2015 | $4,760 | $289,200 | $67,700 | $221,500 |
| 2014 | $4,504 | $263,400 | $67,700 | $195,700 |
Map
- 9 Raymond St
- 204 Wheelock Ave
- 21 Wildwood Rd
- 27 A-B Grafton St
- 22 Wildwood Rd
- 6 Tiffany Cir
- 281 Riverlin St
- 14 Saybrook Rd
- 20 Lordvale Blvd Unit 202
- 23 Upton St
- 164 Weatherstone Dr
- 11 Weatherstone Dr
- 16A Burghardt St
- 59 Samuel Dr
- 1260 Grafton St
- 60 Pointe Rok Dr
- 32 Samuel Dr Unit 32
- 42 John Dr Unit 42
- 70 Lincoln Ln
- 9 Robert Cir Unit 9
Ask me questions while you tour the home.