2 May St Lawrence, MA 01841
Tower Hill NeighborhoodEstimated Value: $698,031 - $806,000
About This Home
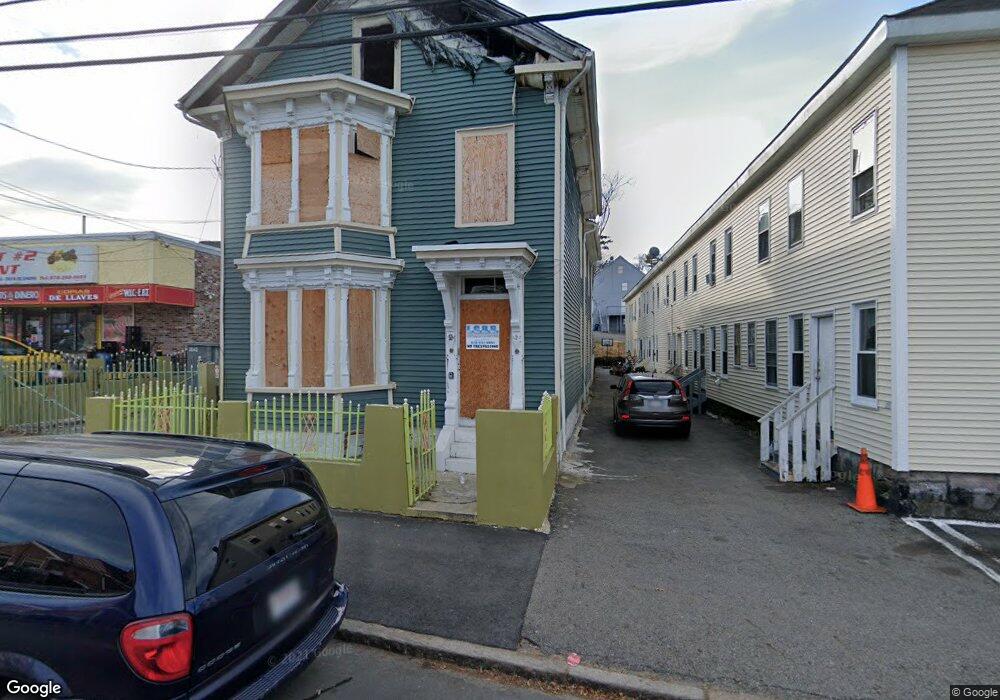
This home is located at 2 May St, Lawrence, MA 01841 and is currently estimated at $765,258, approximately $306 per square foot. 2 May St is a home located in Essex County with nearby schools including James F. Hennessey School, Alexander B. Bruce School, and School For Exceptional Studies.
Ownership History
We collect this data history from publicly available records. To have your information removed, we recommend requesting removal directly through your county’s website.
Purchase Details
Home Financials for this Owner
Home Financials are based on the most recent Mortgage that was taken out on this home.Purchase Details
Home Financials for this Owner
Home Financials are based on the most recent Mortgage that was taken out on this home.Purchase Details
Home Values in the Area
Average Home Value in this Area
Purchase History
We collect this data history from publicly available records. To have your information removed, we recommend requesting removal directly through your county’s website.
| Date | Buyer | Sale Price | Title Company |
|---|---|---|---|
| $277,000 | -- | ||
| $45,000 | -- | ||
| $6,000 | -- |
Mortgage History
We collect this data history from publicly available records. To have your information removed, we recommend requesting removal directly through your county’s website.
| Date | Status | Borrower | Loan Amount |
|---|---|---|---|
| Open | $221,600 | ||
| Previous Owner | $40,500 |
Tax History
We collect this data history from publicly available records. To have your information removed, we recommend requesting removal directly through your county’s website.
| Year | Tax Paid | Tax Assessment Tax Assessment Total Assessment is a certain percentage of the fair market value that is determined by local assessors to be the total taxable value of land and additions on the property. | Land | Improvement |
|---|---|---|---|---|
| 2025 | $6,055 | $688,100 | $101,200 | $586,900 |
| 2024 | $5,935 | $641,600 | $106,400 | $535,200 |
| 2023 | $6,307 | $620,800 | $102,700 | $518,100 |
| 2022 | $5,305 | $463,700 | $96,800 | $366,900 |
| 2021 | $4,778 | $389,400 | $96,800 | $292,600 |
| 2020 | $4,638 | $373,100 | $80,700 | $292,400 |
| 2019 | $4,502 | $329,100 | $60,000 | $269,100 |
| 2018 | $4,096 | $286,000 | $54,300 | $231,700 |
| 2017 | $3,830 | $249,700 | $51,500 | $198,200 |
| 2016 | $3,739 | $241,100 | $40,200 | $200,900 |
| 2015 | $3,586 | $237,200 | $40,200 | $197,000 |
Map
- 15 Crescent St Unit D
- 41 Railroad St
- 87-89 Margin St
- 106-110 Tremont St
- 10 Kempton Ct
- 202 Broadway Unit 2-3
- 202 Broadway Unit 3-2
- 40-42 Holly St
- 18 Hancock St
- 66-68 Water St
- 0 Hudson Ave
- 263-265 Water St
- 267-269 Water St
- 46 Amesbury St Unit 2B
- 95 Myrtle St
- 71-75 Common St
- 11 Lawrence St Unit 510
- 4 Chelmsford St
- 3 Elm St
- 117 Pearl St
- 475 Haverhill St Unit 477
- 475-477 Haverhill St
- 481 Haverhill St
- 18 May St
- 1 Forest St
- 5 Forest St
- 3 Forest St
- 1 Haverhill St
- 476 Haverhill St
- 476 Haverhill St
- 476 1/2 Haverhill St
- 478 Haverhill St
- 478 Haverhill St
- 468 Haverhill St Unit 474
- 480 Haverhill St
- 20 May St
- 9 Forest St
- 7 Forest St
- 11 Forest St
- 487 Haverhill St
Ask me questions while you tour the home.