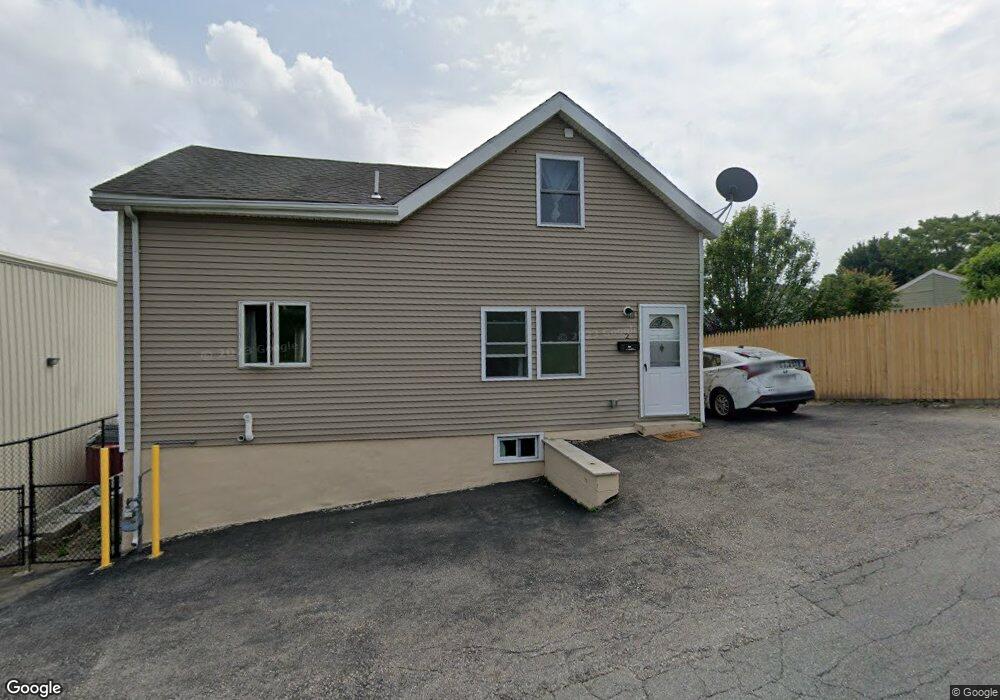
2 Nashua St Worcester, MA 01605
Indian Lake East NeighborhoodEstimated Value: $307,000 - $415,000
4
Beds
1
Bath
1,098
Sq Ft
$325/Sq Ft
Est. Value
About This Home
This home is located at 2 Nashua St, Worcester, MA 01605 and is currently estimated at $356,783, approximately $324 per square foot. 2 Nashua St is a home located in Worcester County with nearby schools including Francis J. McGrath Elementary School, Jacob Hiatt Magnet School, and Chandler Magnet.
Ownership History
Date
Name
Owned For
Owner Type
Purchase Details
Closed on
May 19, 2016
Sold by
Dufresne Kelly and Whalen Michael
Bought by
Nashua Worcester Llc
Current Estimated Value
Home Financials for this Owner
Home Financials are based on the most recent Mortgage that was taken out on this home.
Original Mortgage
$67,500
Outstanding Balance
$52,729
Interest Rate
3.59%
Mortgage Type
New Conventional
Estimated Equity
$304,054
Purchase Details
Closed on
May 13, 2010
Sold by
Blanchette Tr John R and Blanchette Lynne A
Bought by
Dufresne Kelly
Home Financials for this Owner
Home Financials are based on the most recent Mortgage that was taken out on this home.
Original Mortgage
$78,500
Interest Rate
5.11%
Mortgage Type
Purchase Money Mortgage
Purchase Details
Closed on
Dec 10, 2009
Sold by
Blanchette Lynne and Blanchette John R
Bought by
Blanchette Tr John R and Blanchette Lynne A
Create a Home Valuation Report for This Property
The Home Valuation Report is an in-depth analysis detailing your home's value as well as a comparison with similar homes in the area
Home Values in the Area
Average Home Value in this Area
Purchase History
| Date | Buyer | Sale Price | Title Company |
|---|---|---|---|
| Nashua Worcester Llc | $90,000 | -- | |
| Dufresne Kelly | $78,500 | -- | |
| Blanchette Tr John R | -- | -- |
Source: Public Records
Mortgage History
| Date | Status | Borrower | Loan Amount |
|---|---|---|---|
| Open | Nashua Worcester Llc | $67,500 | |
| Previous Owner | Dufresne Kelly | $78,500 |
Source: Public Records
Tax History
| Year | Tax Paid | Tax Assessment Tax Assessment Total Assessment is a certain percentage of the fair market value that is determined by local assessors to be the total taxable value of land and additions on the property. | Land | Improvement |
|---|---|---|---|---|
| 2025 | $3,333 | $252,700 | $53,000 | $199,700 |
| 2024 | $3,161 | $229,900 | $53,000 | $176,900 |
| 2023 | $3,063 | $213,600 | $46,100 | $167,500 |
| 2022 | $2,856 | $187,800 | $36,900 | $150,900 |
| 2021 | $2,751 | $169,000 | $29,500 | $139,500 |
| 2020 | $2,598 | $152,800 | $29,300 | $123,500 |
| 2019 | $2,486 | $138,100 | $25,600 | $112,500 |
| 2018 | $2,466 | $130,400 | $25,600 | $104,800 |
| 2017 | $1,226 | $63,800 | $25,600 | $38,200 |
| 2016 | $1,770 | $85,900 | $19,300 | $66,600 |
| 2015 | $1,724 | $85,900 | $19,300 | $66,600 |
| 2014 | $1,678 | $85,900 | $19,300 | $66,600 |
Source: Public Records
Map
Nearby Homes
- 32 Hemans St
- 63 North St Unit D
- 63 North St Unit C
- 63 North St Unit B
- 63 North St Unit A
- 6 Milton St
- 23 Dryden St
- 27 Harlow St
- 176 Lincoln St Unit 4
- 249 Lincoln St
- 78 Green Hill Pkwy
- 139 Lincoln St
- 41 Westminster St
- 26 Orne St
- 7 Chadwick St
- 95 Green Hill Pkwy
- 51 Uxbridge St
- 6 Mount Vernon St Unit D
- 33 Denmark St
- 6 Ashburnham Rd
Your Personal Tour Guide
Ask me questions while you tour the home.