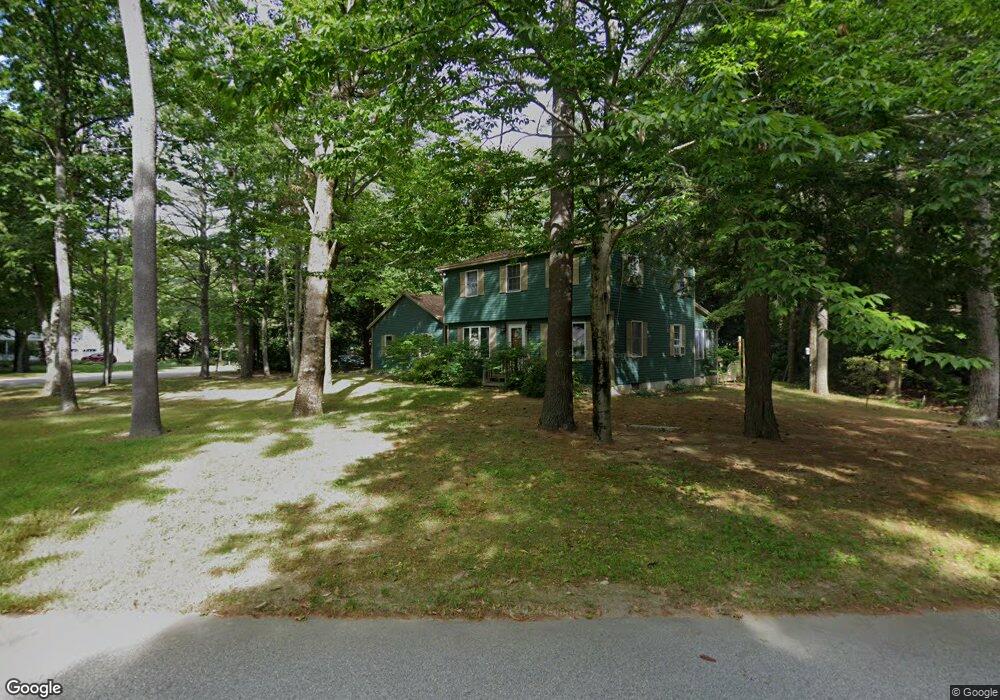
2 Shady Run Ln Gorham, ME 04038
Estimated Value: $573,468 - $670,000
4
Beds
3
Baths
1,880
Sq Ft
$328/Sq Ft
Est. Value
About This Home
This home is located at 2 Shady Run Ln, Gorham, ME 04038 and is currently estimated at $616,867, approximately $328 per square foot. 2 Shady Run Ln is a home with nearby schools including Village Elementary School, Gorham Middle School, and Gorham High School.
Ownership History
Date
Name
Owned For
Owner Type
Purchase Details
Closed on
Aug 30, 2005
Sold by
Rodney John R and Rodney Nancy C
Bought by
Morrell Andrew S and Morrell Andrea L
Current Estimated Value
Home Financials for this Owner
Home Financials are based on the most recent Mortgage that was taken out on this home.
Original Mortgage
$217,760
Outstanding Balance
$113,974
Interest Rate
6%
Mortgage Type
Adjustable Rate Mortgage/ARM
Estimated Equity
$502,893
Create a Home Valuation Report for This Property
The Home Valuation Report is an in-depth analysis detailing your home's value as well as a comparison with similar homes in the area
Home Values in the Area
Average Home Value in this Area
Purchase History
We collect this data history from publicly available records. To have your information removed, we recommend requesting removal directly through your county’s website.
| Date | Buyer | Sale Price | Title Company |
|---|---|---|---|
| Morrell Andrew S | -- | -- |
Source: Public Records
Mortgage History
We collect this data history from publicly available records. To have your information removed, we recommend requesting removal directly through your county’s website.
| Date | Status | Borrower | Loan Amount |
|---|---|---|---|
| Open | Morrell Andrew S | $217,760 | |
| Closed | Morrell Andrew S | $40,830 |
Source: Public Records
Tax History
| Year | Tax Paid | Tax Assessment Tax Assessment Total Assessment is a certain percentage of the fair market value that is determined by local assessors to be the total taxable value of land and additions on the property. | Land | Improvement |
|---|---|---|---|---|
| 2025 | $6,364 | $430,000 | $120,200 | $309,800 |
| 2024 | $6,321 | $430,000 | $120,200 | $309,800 |
| 2023 | $5,913 | $430,000 | $120,200 | $309,800 |
| 2022 | $5,526 | $430,000 | $120,200 | $309,800 |
| 2021 | $5,009 | $258,200 | $106,800 | $151,400 |
| 2020 | $4,906 | $258,200 | $106,800 | $151,400 |
| 2019 | $4,893 | $258,200 | $106,800 | $151,400 |
| 2018 | $4,699 | $258,200 | $106,800 | $151,400 |
| 2017 | $4,415 | $258,200 | $106,800 | $151,400 |
| 2016 | $4,389 | $258,200 | $106,800 | $151,400 |
| 2015 | $4,209 | $258,200 | $106,800 | $151,400 |
| 2014 | $3,812 | $219,100 | $85,000 | $134,100 |
| 2013 | $3,790 | $219,100 | $85,000 | $134,100 |
Source: Public Records
Map
Nearby Homes
- 4 Shady Run Ln
- 6 Samuels Way
- 36 Village Woods Cir
- 24 Solomon Dr
- 37 Weeks Rd
- 91 South St
- 42 Narragansett St
- 176 Weeks Rd
- 6 Narragansett St
- 29 Baxter Ln Unit 8
- 51 Flaggy Meadow Rd
- 282 South St
- 41 Lochwood Dr
- 163 State St
- 21 Lochwood Dr
- 45 Lochwood Dr
- 25 Lochwood Dr
- 10 Elm St
- 49 Lochwood Dr
- 30 Boreal Dr
Your Personal Tour Guide
Ask me questions while you tour the home.