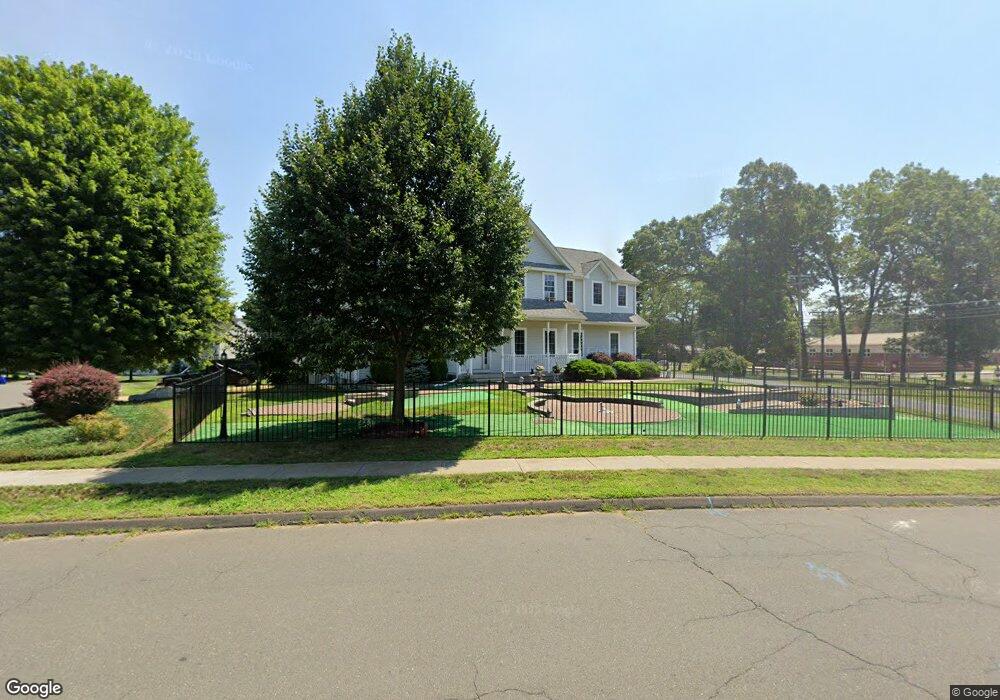
2 Szepanski Rd Windsor Locks, CT 06096
Estimated Value: $535,719 - $648,000
3
Beds
3
Baths
2,683
Sq Ft
$218/Sq Ft
Est. Value
About This Home
This home is located at 2 Szepanski Rd, Windsor Locks, CT 06096 and is currently estimated at $584,930, approximately $218 per square foot. 2 Szepanski Rd is a home located in Hartford County with nearby schools including North Street School, South Elementary School, and Windsor Locks Middle School.
Ownership History
Date
Name
Owned For
Owner Type
Purchase Details
Closed on
Jun 28, 2011
Sold by
T & M Building Co Inc
Bought by
Duan Yimin and Duan Fanying
Current Estimated Value
Home Financials for this Owner
Home Financials are based on the most recent Mortgage that was taken out on this home.
Original Mortgage
$288,000
Outstanding Balance
$18,654
Interest Rate
3.83%
Mortgage Type
Purchase Money Mortgage
Estimated Equity
$566,276
Purchase Details
Closed on
May 29, 2002
Sold by
Szepanski Edward and Szepanski Pauline
Bought by
North Group Dev Llc
Create a Home Valuation Report for This Property
The Home Valuation Report is an in-depth analysis detailing your home's value as well as a comparison with similar homes in the area
Home Values in the Area
Average Home Value in this Area
Purchase History
| Date | Buyer | Sale Price | Title Company |
|---|---|---|---|
| Duan Yimin | $360,000 | -- | |
| North Group Dev Llc | $84,900 | -- |
Source: Public Records
Mortgage History
| Date | Status | Borrower | Loan Amount |
|---|---|---|---|
| Open | North Group Dev Llc | $288,000 |
Source: Public Records
Tax History
| Year | Tax Paid | Tax Assessment Tax Assessment Total Assessment is a certain percentage of the fair market value that is determined by local assessors to be the total taxable value of land and additions on the property. | Land | Improvement |
|---|---|---|---|---|
| 2025 | $9,768 | $407,190 | $66,990 | $340,200 |
| 2024 | $6,156 | $218,750 | $53,340 | $165,410 |
| 2023 | $5,760 | $218,750 | $53,340 | $165,410 |
| 2022 | $5,650 | $218,750 | $53,340 | $165,410 |
| 2021 | $5,650 | $218,750 | $53,340 | $165,410 |
| 2020 | $5,650 | $218,750 | $53,340 | $165,410 |
| 2019 | $5,650 | $218,750 | $53,340 | $165,410 |
| 2017 | $6,001 | $225,100 | $51,700 | $173,400 |
| 2016 | $5,980 | $224,300 | $51,700 | $172,600 |
| 2015 | $6,009 | $224,300 | $51,700 | $172,600 |
| 2014 | $6,232 | $237,600 | $55,500 | $182,100 |
Source: Public Records
Map
Nearby Homes
- 13 Quail Ct
- 66 Woodcock Ct Unit 66
- 80 West St
- 13 Jubrey Ln
- 202 Reed Ave
- 4 Woodland Hollow St
- 404 Woodland St
- 15 Suffield St
- 13 Pine Dr
- 59 Elm St
- 34 Cornwall Dr
- 3 Concorde Way Unit B1
- 0 N Water St Unit 24138494
- 0 N Water St Unit 24128295
- 0 N Water St Unit 24128294
- 0 N Water St Unit 24128288
- 0 N Water St
- 32 Walnut Cir
- 7 Concorde Way Unit B2
- 24 Coolidge St
Your Personal Tour Guide
Ask me questions while you tour the home.