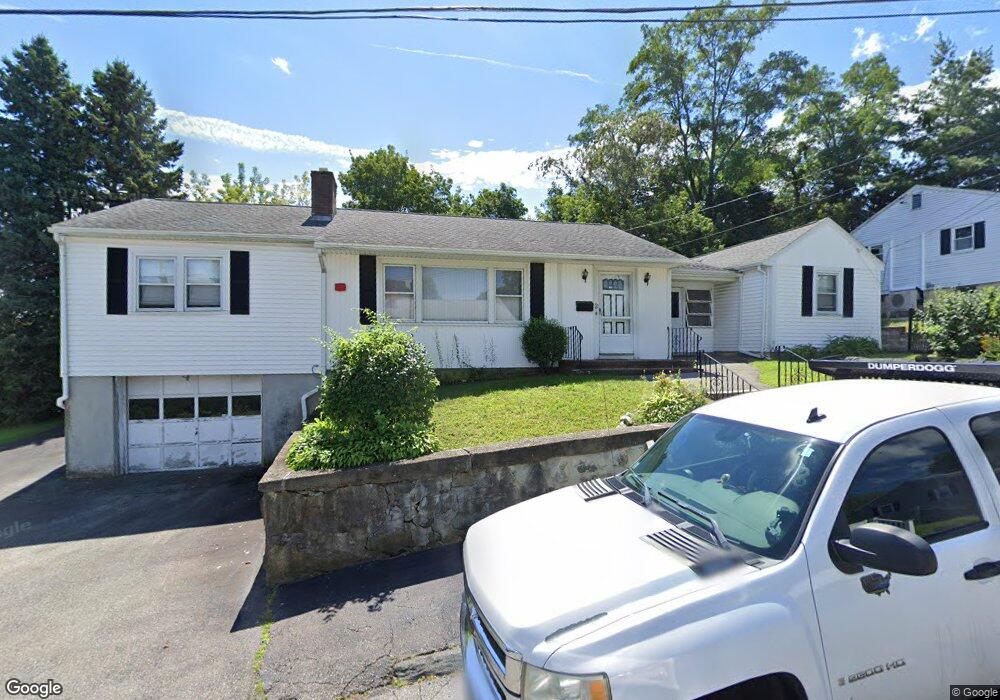
2 Wiley St Woburn, MA 01801
Downtown Woburn NeighborhoodEstimated Value: $598,000 - $708,000
3
Beds
2
Baths
1,344
Sq Ft
$495/Sq Ft
Est. Value
About This Home
This home is located at 2 Wiley St, Woburn, MA 01801 and is currently estimated at $665,805, approximately $495 per square foot. 2 Wiley St is a home located in Middlesex County with nearby schools including Goodyear Elementary School, Daniel L. Joyce Middle School, and Woburn High School.
Ownership History
Date
Name
Owned For
Owner Type
Purchase Details
Closed on
Dec 19, 2008
Sold by
Oconnell Alice E and Barrucci Donald D
Bought by
Digirolamo Robert P
Current Estimated Value
Home Financials for this Owner
Home Financials are based on the most recent Mortgage that was taken out on this home.
Original Mortgage
$225,000
Outstanding Balance
$149,682
Interest Rate
6.27%
Mortgage Type
Purchase Money Mortgage
Estimated Equity
$516,123
Create a Home Valuation Report for This Property
The Home Valuation Report is an in-depth analysis detailing your home's value as well as a comparison with similar homes in the area
Home Values in the Area
Average Home Value in this Area
Purchase History
| Date | Buyer | Sale Price | Title Company |
|---|---|---|---|
| Digirolamo Robert P | $250,000 | -- | |
| Digirolamo Robert P | $250,000 | -- |
Source: Public Records
Mortgage History
| Date | Status | Borrower | Loan Amount |
|---|---|---|---|
| Open | Digirolamo Robert P | $225,000 | |
| Closed | Digirolamo Robert P | $225,000 |
Source: Public Records
Tax History
| Year | Tax Paid | Tax Assessment Tax Assessment Total Assessment is a certain percentage of the fair market value that is determined by local assessors to be the total taxable value of land and additions on the property. | Land | Improvement |
|---|---|---|---|---|
| 2025 | $4,674 | $547,300 | $291,400 | $255,900 |
| 2024 | $4,440 | $550,900 | $284,100 | $266,800 |
| 2023 | $4,487 | $515,800 | $258,300 | $257,500 |
| 2022 | $4,380 | $469,000 | $224,600 | $244,400 |
| 2021 | $4,127 | $442,300 | $213,900 | $228,400 |
| 2020 | $3,865 | $414,700 | $213,900 | $200,800 |
| 2019 | $3,692 | $388,600 | $203,700 | $184,900 |
| 2018 | $3,542 | $358,100 | $186,900 | $171,200 |
| 2017 | $3,441 | $346,200 | $178,000 | $168,200 |
| 2016 | $3,282 | $326,600 | $166,400 | $160,200 |
| 2015 | $3,157 | $310,400 | $155,500 | $154,900 |
| 2014 | $2,893 | $277,100 | $155,500 | $121,600 |
Source: Public Records
Map
Nearby Homes
- 109 Main St Unit 2
- 3 Conn St Unit 3
- 380 Cross St
- 18-20 Buck St Unit 1
- 16 Glenwood Ave
- 7 Sherman Place
- 307 Cross St
- 149 Horn Pond Brook Rd
- 6 Richmond Park
- 0 Mount Pleasant St
- 2 George Rd Unit 2
- 104 Eastern Ave
- 237 Swanton St
- 38 Salem St Unit 40
- 27 Arlington Rd Unit 2
- 7 Conant Rd Unit 53
- 15 East St
- 31 Arlington Rd Unit 1-6
- 200 Swanton St Unit 228
- 200 Swanton St Unit 538
Your Personal Tour Guide
Ask me questions while you tour the home.