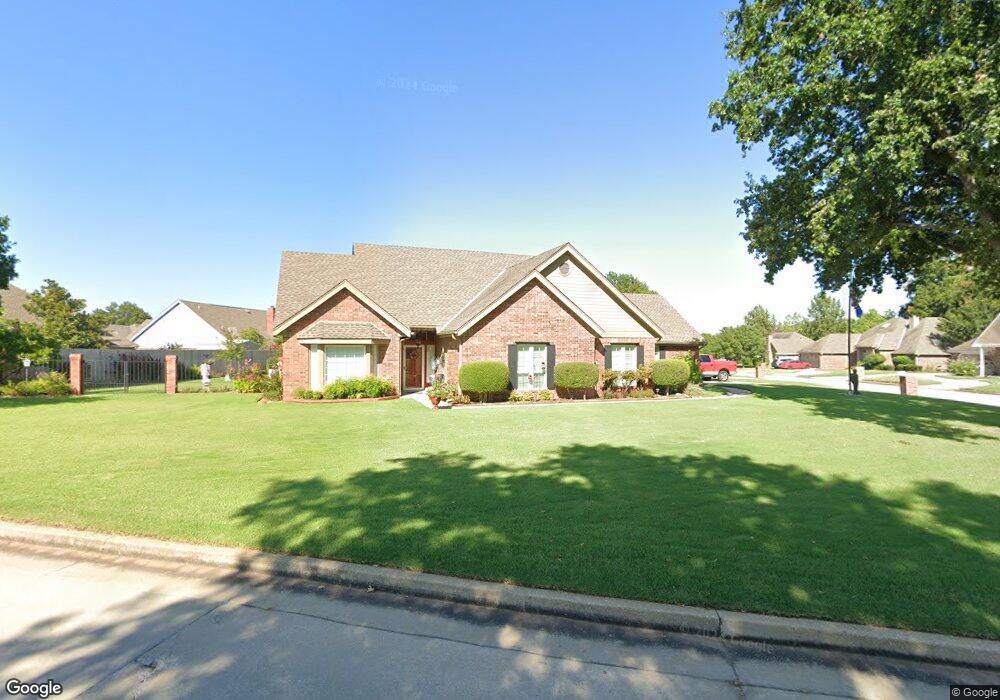
2 Windsor Ct Shawnee, OK 74804
Estimated Value: $249,830 - $267,000
About This Home
This home is located at 2 Windsor Ct, Shawnee, OK 74804 and is currently estimated at $260,208, approximately $137 per square foot. 2 Windsor Ct is a home located in Pottawatomie County.
Ownership History
We collect this data history from publicly available records. To have your information removed, we recommend requesting removal directly through your county’s website.
Purchase Details
Home Financials for this Owner
Home Financials are based on the most recent Mortgage that was taken out on this home.Purchase Details
Purchase Details
Purchase Details
Purchase History
We collect this data history from publicly available records. To have your information removed, we recommend requesting removal directly through your county’s website.
| Date | Buyer | Sale Price | Title Company |
|---|---|---|---|
| $160,000 | None Available | ||
| $136,500 | -- | ||
| $135,500 | -- | ||
| $126,000 | -- |
Mortgage History
We collect this data history from publicly available records. To have your information removed, we recommend requesting removal directly through your county’s website.
| Date | Status | Borrower | Loan Amount |
|---|---|---|---|
| Open | $158,746 |
Tax History
We collect this data history from publicly available records. To have your information removed, we recommend requesting removal directly through your county’s website.
| Year | Tax Paid | Tax Assessment Tax Assessment Total Assessment is a certain percentage of the fair market value that is determined by local assessors to be the total taxable value of land and additions on the property. | Land | Improvement |
|---|---|---|---|---|
| 2025 | $1,739 | $19,538 | $1,885 | $17,653 |
| 2024 | $1,762 | $19,538 | $1,821 | $17,717 |
| 2023 | $1,762 | $19,538 | $2,940 | $16,598 |
| 2022 | $1,728 | $19,538 | $2,940 | $16,598 |
| 2021 | $1,744 | $19,538 | $2,940 | $16,598 |
| 2020 | $1,807 | $20,237 | $2,940 | $17,297 |
| 2019 | $1,850 | $20,473 | $2,940 | $17,533 |
| 2018 | $1,887 | $20,760 | $2,940 | $17,820 |
| 2017 | $1,916 | $21,223 | $2,940 | $18,283 |
| 2016 | $1,914 | $20,981 | $2,875 | $18,106 |
| 2015 | $1,638 | $20,369 | $2,804 | $17,565 |
| 2014 | $1,588 | $19,776 | $2,674 | $17,102 |
Map
- 3 Brentwood Place
- 9 Castle Creek Place
- 1402 Nottingham Place
- 1301 Manchester
- 0 Elberta Ave
- 1503 Berkshire Place
- 3908 Northridge Dr
- 3910 Northridge Dr
- 3910 Northridge Rd
- 3902 Northridge Rd
- 3904 Northridge Rd
- 3908 Northridge Rd
- 3906 Northridge Rd
- 3917 Northridge Rd
- 3907 Northridge Rd
- 3911 Northridge Rd
- 1105 Cypress Ct
- 3913 Northridge Rd
- 3915 Northridge Rd
- 3901 Northridge Rd
- 1316 Windsor Place
- 1314 Windsor Place
- 1313 Castle Creek St
- 1 Castle Creek Place
- 4 Windsor Ct
- 1312 Windsor Place
- 6 Windsor Ct
- 1311 Castle Creek St
- 8 Windsor Ct
- 1315 Windsor Place
- 2704 Crown Point
- 2 Castle Creek Place
- 1313 Windsor Place
- 1310 Windsor Place
- 1309 Castle Creek St
- 1311 Windsor Place
- 3 Castle Creek Place
- 1309 Windsor Place
- 4 Brentwood Place
- 1312 Castle Creek St
Ask me questions while you tour the home.