20 Central St Bellingham, MA 02019
Estimated Value: $497,000 - $559,000
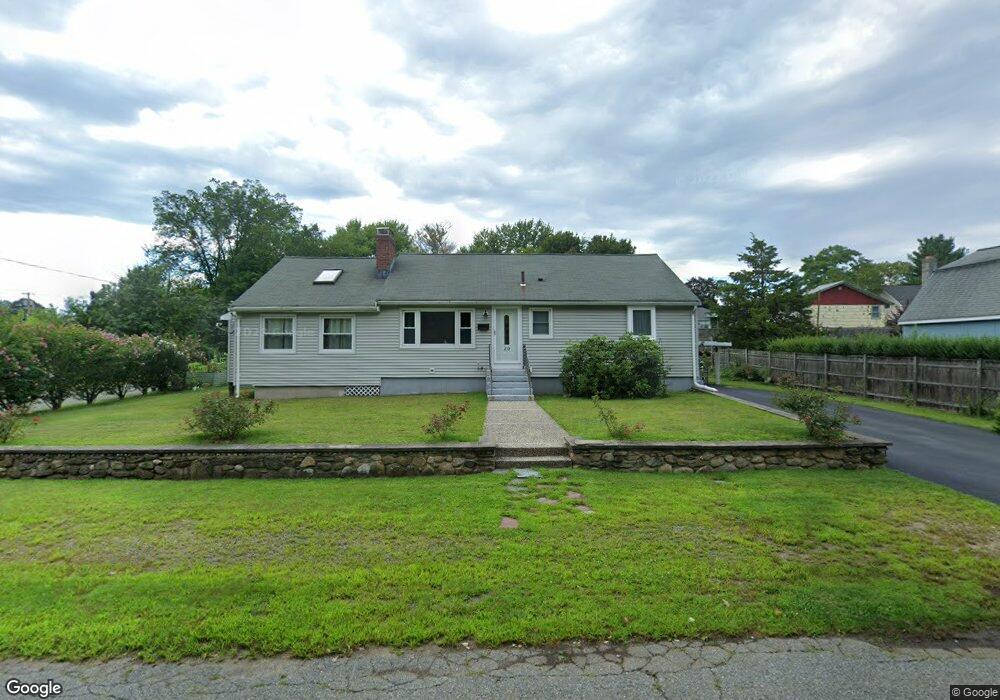
About This Home
This home is located at 20 Central St, Bellingham, MA 02019 and is currently estimated at $520,507, approximately $206 per square foot. 20 Central St is a home located in Norfolk County with nearby schools including Joseph F. DiPietro Elementary, Bellingham High School, and Rise Prep Mayoral Academy Middle School.
Ownership History
We collect this data history from publicly available records. To have your information removed, we recommend requesting removal directly through your county’s website.
Purchase Details
Purchase Details
Home Financials for this Owner
Home Financials are based on the most recent Mortgage that was taken out on this home.Home Values in the Area
Average Home Value in this Area
Purchase History
We collect this data history from publicly available records. To have your information removed, we recommend requesting removal directly through your county’s website.
| Date | Buyer | Sale Price | Title Company |
|---|---|---|---|
| -- | None Available | ||
| -- | None Available | ||
| $145,500 | -- | ||
| $145,500 | -- |
Mortgage History
We collect this data history from publicly available records. To have your information removed, we recommend requesting removal directly through your county’s website.
| Date | Status | Borrower | Loan Amount |
|---|---|---|---|
| Previous Owner | $169,000 | ||
| Previous Owner | $116,400 |
Tax History
We collect this data history from publicly available records. To have your information removed, we recommend requesting removal directly through your county’s website.
| Year | Tax Paid | Tax Assessment Tax Assessment Total Assessment is a certain percentage of the fair market value that is determined by local assessors to be the total taxable value of land and additions on the property. | Land | Improvement |
|---|---|---|---|---|
| 2025 | $4,973 | $395,900 | $124,700 | $271,200 |
| 2024 | $4,406 | $342,600 | $113,800 | $228,800 |
| 2023 | $4,245 | $325,300 | $108,400 | $216,900 |
| 2022 | $4,166 | $295,900 | $90,400 | $205,500 |
| 2021 | $4,007 | $278,100 | $90,400 | $187,700 |
| 2020 | $3,771 | $265,200 | $90,400 | $174,800 |
| 2019 | $3,675 | $258,600 | $90,400 | $168,200 |
| 2018 | $3,422 | $237,500 | $87,900 | $149,600 |
| 2017 | $3,320 | $231,500 | $87,900 | $143,600 |
| 2016 | $3,102 | $217,100 | $90,200 | $126,900 |
| 2015 | $2,997 | $210,300 | $87,500 | $122,800 |
| 2014 | $3,193 | $217,800 | $92,100 | $125,700 |
Map
- 81 Winter St
- 30 Orchard St
- 21 Andrews St
- 20 Cooks Ln
- 194 Paine St
- Lot 2 Pulaski Blvd
- 61 Pine Grove Ave
- 33 Achille St
- 76 Dewey St
- 188 Saint Louis Ave
- 200 Saint Louis Ave
- 67 Garden St
- 212 Saint Louis Ave
- 70 Oswego St
- 213 St Louis Ave
- 65 Bellingham St
- 555 Diamond Hill Rd Unit 303
- 4 Cheney St
- 39 Elvira St
- 285 Saint Louis Ave
Ask me questions while you tour the home.