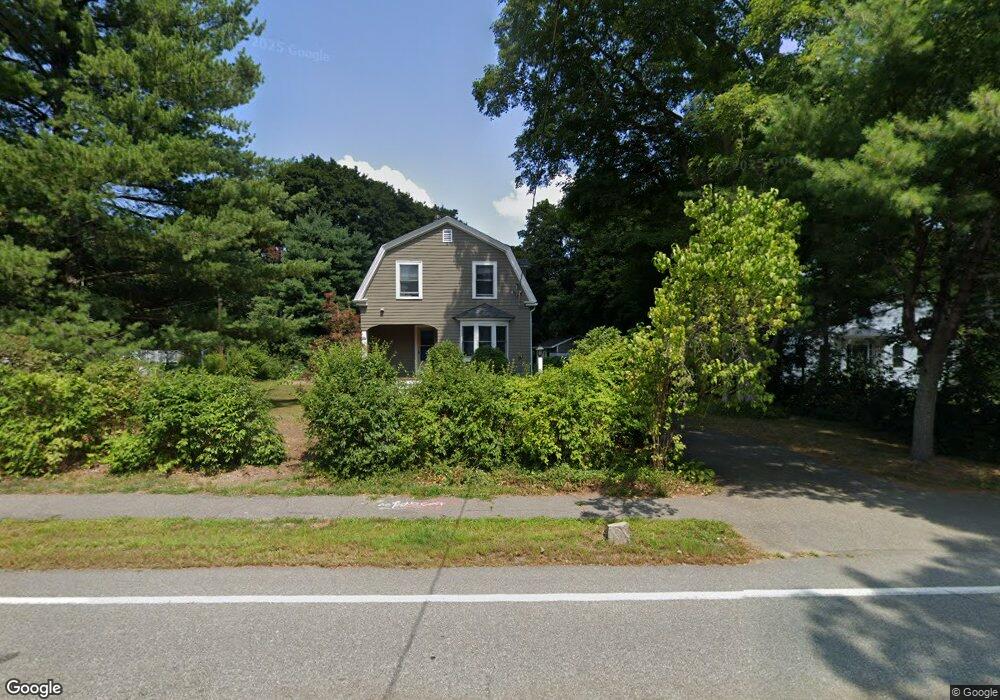
20 Cherry St Wenham, MA 01984
Estimated Value: $966,762 - $1,247,000
3
Beds
4
Baths
1,712
Sq Ft
$649/Sq Ft
Est. Value
About This Home
This home is located at 20 Cherry St, Wenham, MA 01984 and is currently estimated at $1,111,941, approximately $649 per square foot. 20 Cherry St is a home located in Essex County with nearby schools including Winthrop School, Bessie Buker Elementary School, and Cutler Elementary School.
Ownership History
Date
Name
Owned For
Owner Type
Purchase Details
Closed on
May 24, 2013
Sold by
Sean W Condon Lt and Condon Sean W
Bought by
Ross Jane B and Condow Sean W
Current Estimated Value
Purchase Details
Closed on
Mar 5, 2008
Sold by
Ross Jane B and Condon Sean W
Bought by
Condon Sean W
Purchase Details
Closed on
May 31, 2002
Sold by
Morris Allen H and Morris Eileen R
Bought by
Condon Sean W and Ross Jane B
Purchase Details
Closed on
Jun 16, 1992
Sold by
Anderson Hazel A
Bought by
Schnabel Lindsay C
Create a Home Valuation Report for This Property
The Home Valuation Report is an in-depth analysis detailing your home's value as well as a comparison with similar homes in the area
Home Values in the Area
Average Home Value in this Area
Purchase History
| Date | Buyer | Sale Price | Title Company |
|---|---|---|---|
| Ross Jane B | -- | -- | |
| Condon Sean W | -- | -- | |
| Condon Sean W | $480,000 | -- | |
| Schnabel Lindsay C | $175,000 | -- |
Source: Public Records
Mortgage History
| Date | Status | Borrower | Loan Amount |
|---|---|---|---|
| Open | Schnabel Lindsay C | $130,000 |
Source: Public Records
Tax History
| Year | Tax Paid | Tax Assessment Tax Assessment Total Assessment is a certain percentage of the fair market value that is determined by local assessors to be the total taxable value of land and additions on the property. | Land | Improvement |
|---|---|---|---|---|
| 2025 | $13,005 | $836,900 | $521,400 | $315,500 |
| 2024 | $12,761 | $814,900 | $521,400 | $293,500 |
| 2023 | $12,485 | $719,600 | $515,100 | $204,500 |
| 2022 | $10,918 | $557,600 | $353,200 | $204,400 |
| 2021 | $10,458 | $531,400 | $327,000 | $204,400 |
| 2020 | $9,627 | $508,300 | $325,700 | $182,600 |
| 2019 | $9,160 | $508,300 | $325,700 | $182,600 |
| 2018 | $8,162 | $434,400 | $315,300 | $119,100 |
| 2017 | $7,963 | $434,400 | $315,300 | $119,100 |
| 2016 | $7,376 | $434,400 | $315,300 | $119,100 |
| 2015 | $6,593 | $405,700 | $286,600 | $119,100 |
Source: Public Records
Map
Nearby Homes
Your Personal Tour Guide
Ask me questions while you tour the home.