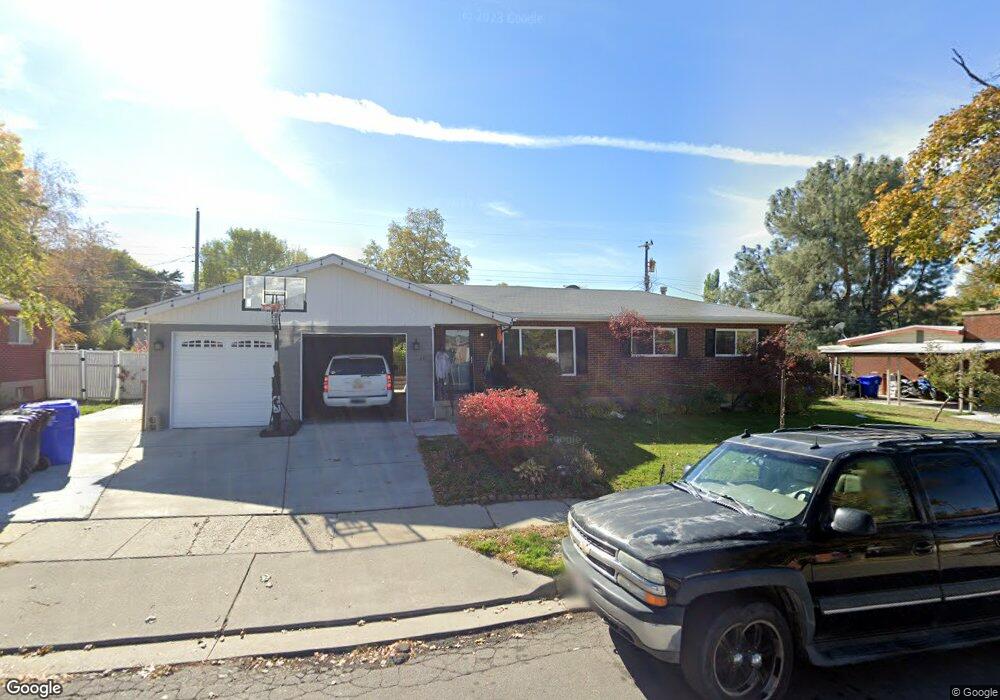
20 E 1300 S Bountiful, UT 84010
Estimated Value: $541,000 - $580,262
5
Beds
3
Baths
2,544
Sq Ft
$219/Sq Ft
Est. Value
About This Home
This home is located at 20 E 1300 S, Bountiful, UT 84010 and is currently estimated at $556,816, approximately $218 per square foot. 20 E 1300 S is a home located in Davis County with nearby schools including Bountiful Elementary School, Millcreek Junior High School, and Bountiful High School.
Ownership History
Date
Name
Owned For
Owner Type
Purchase Details
Closed on
Jan 9, 2019
Sold by
Bean Sue Ann and The Norma Ann Lund Family Trus
Bought by
Petela Mark A
Current Estimated Value
Home Financials for this Owner
Home Financials are based on the most recent Mortgage that was taken out on this home.
Original Mortgage
$256,000
Outstanding Balance
$225,541
Interest Rate
4.8%
Mortgage Type
New Conventional
Estimated Equity
$331,275
Purchase Details
Closed on
Feb 10, 2016
Sold by
Lund Norma
Bought by
Lund Norma Ann
Create a Home Valuation Report for This Property
The Home Valuation Report is an in-depth analysis detailing your home's value as well as a comparison with similar homes in the area
Purchase History
| Date | Buyer | Sale Price | Title Company |
|---|---|---|---|
| Petela Mark A | -- | Utah First Title Ins A | |
| Lund Norma Ann | -- | Attorney |
Source: Public Records
Mortgage History
| Date | Status | Borrower | Loan Amount |
|---|---|---|---|
| Open | Petela Mark A | $256,000 |
Source: Public Records
Tax History
| Year | Tax Paid | Tax Assessment Tax Assessment Total Assessment is a certain percentage of the fair market value that is determined by local assessors to be the total taxable value of land and additions on the property. | Land | Improvement |
|---|---|---|---|---|
| 2025 | $3,342 | $289,850 | $124,909 | $164,941 |
| 2024 | $3,081 | $279,950 | $109,495 | $170,455 |
| 2023 | $3,095 | $486,000 | $203,447 | $282,553 |
| 2022 | $3,244 | $283,250 | $111,635 | $171,615 |
| 2021 | $2,836 | $412,000 | $146,014 | $265,986 |
| 2020 | $2,587 | $365,000 | $125,358 | $239,642 |
| 2019 | $2,415 | $335,000 | $136,752 | $198,248 |
| 2018 | $1,983 | $275,000 | $134,614 | $140,386 |
| 2016 | $1,708 | $128,205 | $54,817 | $73,388 |
| 2015 | $1,702 | $120,780 | $54,817 | $65,963 |
| 2014 | $31 | $128,783 | $54,817 | $73,966 |
| 2013 | -- | $108,657 | $42,890 | $65,767 |
Source: Public Records
Map
Nearby Homes
- 141 E 1650 S
- 1350 S 200 W
- 1314 S 200 W Unit 19
- 380 E 1500 S
- 1820 S 50 W
- 545 S 100 E
- 650 S Main St Unit 7107
- 650 S Main St Unit 6206
- 650 S Main St Unit 4104
- 650 S Main St Unit 9106
- 190 W 1800 S
- 323 Peach Ln
- 275 E Peach Ln S
- 1016 S 400 W
- 34 W 400 S
- 1940 S 200 W Unit 3
- 2 E Wicker Ln
- 32 W 400 S
- 2064 S Orchard Dr
- 357 S 100 E
Your Personal Tour Guide
Ask me questions while you tour the home.