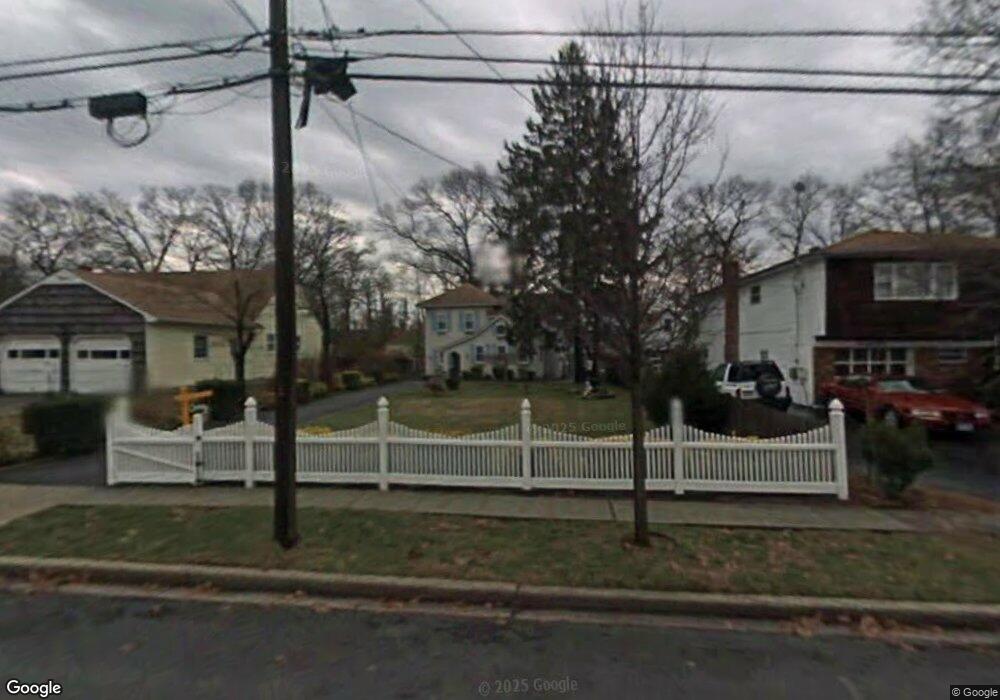
20 E Walnut St Massapequa, NY 11758
Estimated Value: $564,000 - $667,000
3
Beds
1
Bath
1,674
Sq Ft
$365/Sq Ft
Est. Value
About This Home
This home is located at 20 E Walnut St, Massapequa, NY 11758 and is currently estimated at $610,982, approximately $364 per square foot. 20 E Walnut St is a home located in Nassau County with nearby schools including Northeast Elementary School, Northwest Elementary School, and Park Avenue Memorial Elementary School.
Ownership History
Date
Name
Owned For
Owner Type
Purchase Details
Closed on
Mar 9, 2018
Sold by
Murray Dana Susan
Bought by
Vaughan Jessica R and Vaughan Kim R
Current Estimated Value
Home Financials for this Owner
Home Financials are based on the most recent Mortgage that was taken out on this home.
Original Mortgage
$269,637
Outstanding Balance
$228,975
Interest Rate
4.37%
Mortgage Type
FHA
Estimated Equity
$382,007
Purchase Details
Closed on
Dec 8, 2015
Sold by
Murray Daniel
Bought by
Murray Dana Susan
Purchase Details
Closed on
Sep 12, 2007
Sold by
Stevralia James
Bought by
Murray Daniel
Create a Home Valuation Report for This Property
The Home Valuation Report is an in-depth analysis detailing your home's value as well as a comparison with similar homes in the area
Home Values in the Area
Average Home Value in this Area
Purchase History
| Date | Buyer | Sale Price | Title Company |
|---|---|---|---|
| Vaughan Jessica R | $305,000 | None Available | |
| Murray Dana Susan | -- | Titlevest | |
| Murray Daniel | $361,000 | -- |
Source: Public Records
Mortgage History
| Date | Status | Borrower | Loan Amount |
|---|---|---|---|
| Open | Vaughan Jessica R | $269,637 |
Source: Public Records
Tax History
| Year | Tax Paid | Tax Assessment Tax Assessment Total Assessment is a certain percentage of the fair market value that is determined by local assessors to be the total taxable value of land and additions on the property. | Land | Improvement |
|---|---|---|---|---|
| 2025 | $10,467 | $343 | $135 | $208 |
| 2024 | $2,798 | $343 | $135 | $208 |
| 2023 | $9,921 | $343 | $135 | $208 |
| 2022 | $9,921 | $343 | $135 | $208 |
| 2021 | $10,460 | $333 | $131 | $202 |
| 2020 | $11,046 | $555 | $466 | $89 |
| 2019 | $2,893 | $555 | $437 | $118 |
| 2018 | $7,664 | $592 | $0 | $0 |
| 2017 | $7,427 | $658 | $466 | $192 |
| 2016 | $10,540 | $658 | $466 | $192 |
| 2015 | $2,789 | $658 | $466 | $192 |
| 2014 | $2,789 | $658 | $466 | $192 |
| 2013 | $2,532 | $658 | $466 | $192 |
Source: Public Records
Map
Nearby Homes
- 35 Kenwood Ave
- 196 Somerset Dr
- 170 Southampton Dr
- 169 Sterling Place
- 75 Warwick Dr
- 41 Nancy Place
- 54 Grand St
- 119 Francesca Way Unit 119
- 137 Francesca Way
- 137 Melrose Ave
- 105 Francesca Way Unit 105
- 138 Eastgate Rd
- 17 Linwood Place
- 34 Sarah Ct
- 22 S Gate
- 110 Kenneth Ct
- 71 Park Ln
- 2 Mcleod St
- 3 Nancy Place
- 66 Sarah Ct
Your Personal Tour Guide
Ask me questions while you tour the home.