20 Jasper St Saugus, MA 01906
Downtown Saugus NeighborhoodEstimated Value: $631,000 - $682,000
About This Home
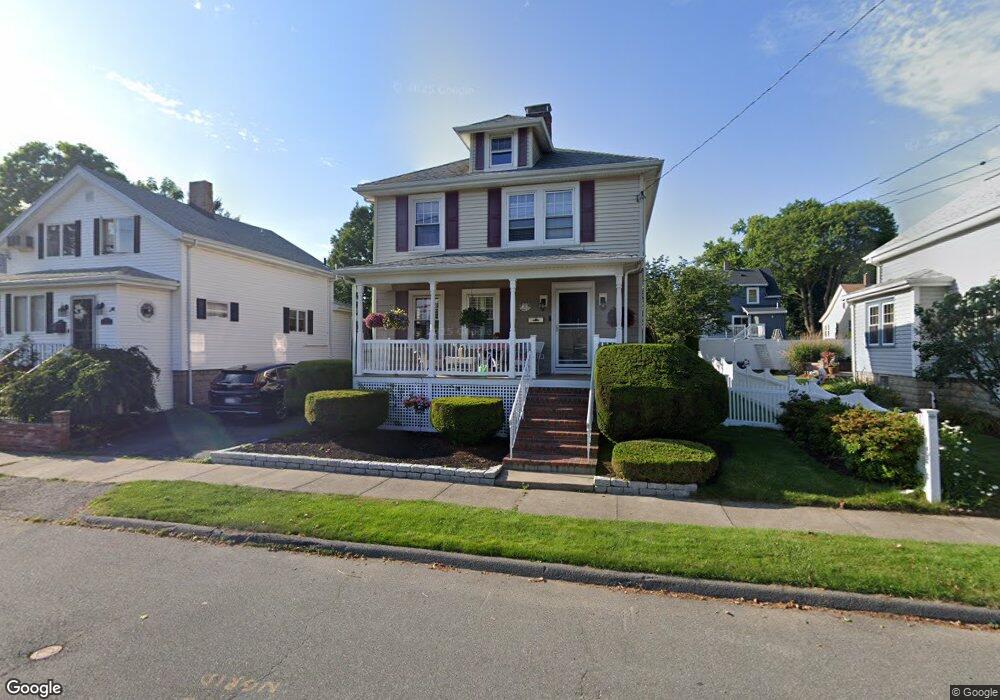
This home is located at 20 Jasper St, Saugus, MA 01906 and is currently estimated at $654,150, approximately $471 per square foot. 20 Jasper St is a home located in Essex County with nearby schools including Saugus High School, Pioneer Charter School Of Science II, and Sacred Heart School.
Ownership History
We collect this data history from publicly available records. To have your information removed, we recommend requesting removal directly through your county’s website.
Purchase Details
Purchase Details
Home Values in the Area
Average Home Value in this Area
Purchase History
We collect this data history from publicly available records. To have your information removed, we recommend requesting removal directly through your county’s website.
| Date | Buyer | Sale Price | Title Company |
|---|---|---|---|
| -- | -- | ||
| -- | -- |
Mortgage History
We collect this data history from publicly available records. To have your information removed, we recommend requesting removal directly through your county’s website.
| Date | Status | Borrower | Loan Amount |
|---|---|---|---|
| Previous Owner | $100,000 | ||
| Previous Owner | $35,000 | ||
| Previous Owner | $35,000 |
Tax History
We collect this data history from publicly available records. To have your information removed, we recommend requesting removal directly through your county’s website.
| Year | Tax Paid | Tax Assessment Tax Assessment Total Assessment is a certain percentage of the fair market value that is determined by local assessors to be the total taxable value of land and additions on the property. | Land | Improvement |
|---|---|---|---|---|
| 2025 | $6,100 | $571,200 | $313,100 | $258,100 |
| 2024 | $5,938 | $557,600 | $304,600 | $253,000 |
| 2023 | $5,771 | $512,500 | $266,500 | $246,000 |
| 2022 | $5,526 | $460,100 | $247,900 | $212,200 |
| 2021 | $4,972 | $402,900 | $205,600 | $197,300 |
| 2020 | $4,590 | $385,100 | $195,500 | $189,600 |
| 2019 | $4,576 | $375,700 | $186,100 | $189,600 |
| 2018 | $4,138 | $357,300 | $177,700 | $179,600 |
| 2017 | $4,027 | $334,200 | $179,200 | $155,000 |
| 2016 | $3,312 | $271,500 | $170,200 | $101,300 |
| 2015 | $3,107 | $258,500 | $162,100 | $96,400 |
| 2014 | $3,240 | $279,100 | $162,100 | $117,000 |
Map
- 5 Vermont Ave
- 8 Woodbury Ave
- 19 Saville St
- 46 Hesper St
- 19 Laconia Ave
- 19 Juliette Rd
- 12 Bisbee Rd
- 4 Oneil Way
- 1 Twin Springs Dr
- 3 Phillips Ave
- 69 Appleton St
- 8 Austin Ct Unit B
- 1 Rhodes St
- 25 Wonderland Ave
- 141 Essex St Unit B2
- 9 Cleveland Ave
- 9 Hood St
- 9 Nirvana Dr Unit 2E
- 8 Ballard St
- 8 Lincoln Ct
- 22 Jasper St
- 18 Jasper St
- 24 Jasper St
- 21 Jasper St
- 16 Jasper St
- 21 Pearson St
- 23 Jasper St
- 26 Jasper St
- 19 Pearson St
- 19 Jasper St
- 17 Pearson St
- 14 Jasper St
- 23 Pearson St
- 25 Jasper St Unit 27
- 27 Jasper St Unit 1 Bedroom Appartment
- 17 Jasper St
- 13 Pearson St
- 28 Jasper St
- 27 Pearson St
- 20 Pearson St
Ask me questions while you tour the home.