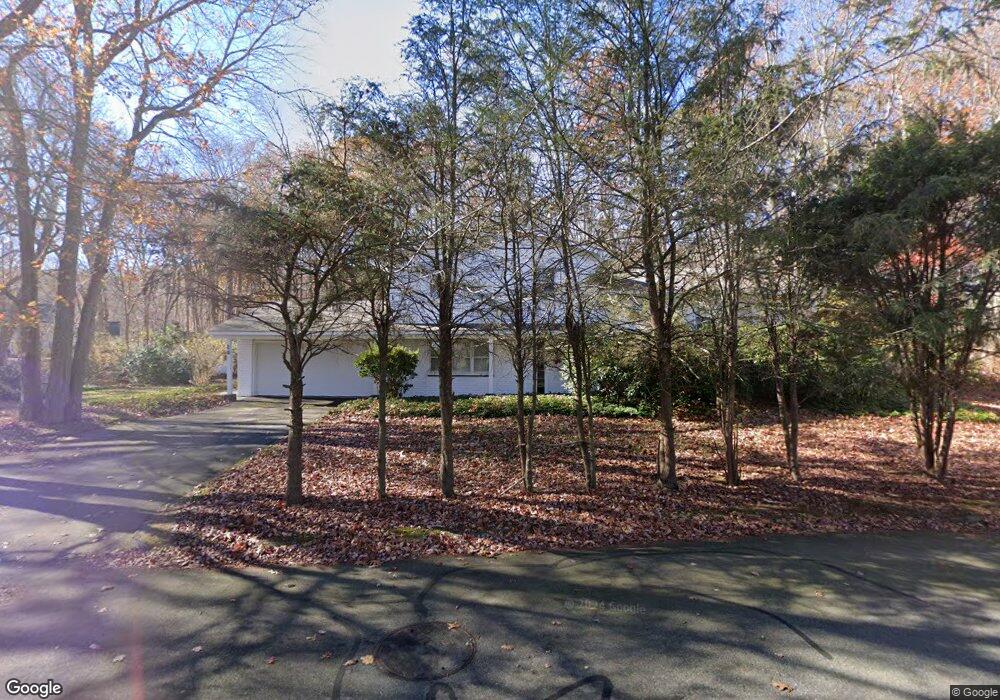
20 Mohawk Dr Niantic, CT 06357
Estimated Value: $576,972 - $746,000
3
Beds
3
Baths
1,404
Sq Ft
$466/Sq Ft
Est. Value
About This Home
This home is located at 20 Mohawk Dr, Niantic, CT 06357 and is currently estimated at $653,743, approximately $465 per square foot. 20 Mohawk Dr is a home located in New London County with nearby schools including East Lyme Middle School, East Lyme High School, and The Light House Voc-Ed Center.
Ownership History
Date
Name
Owned For
Owner Type
Purchase Details
Closed on
Jun 30, 2000
Sold by
Walker Michael A
Bought by
Foulke Bruce R and Foulke Sabrina
Current Estimated Value
Purchase Details
Closed on
Feb 27, 1998
Sold by
Wysocki Mary Lou N
Bought by
Walker Michael A
Create a Home Valuation Report for This Property
The Home Valuation Report is an in-depth analysis detailing your home's value as well as a comparison with similar homes in the area
Home Values in the Area
Average Home Value in this Area
Purchase History
| Date | Buyer | Sale Price | Title Company |
|---|---|---|---|
| Foulke Bruce R | $195,000 | -- | |
| Walker Michael A | $183,000 | -- | |
| Foulke Bruce R | $195,000 | -- | |
| Walker Michael A | $183,000 | -- |
Source: Public Records
Mortgage History
| Date | Status | Borrower | Loan Amount |
|---|---|---|---|
| Open | Walker Michael A | $257,550 | |
| Closed | Walker Michael A | $34,346 | |
| Closed | Walker Michael A | $196,000 |
Source: Public Records
Tax History
| Year | Tax Paid | Tax Assessment Tax Assessment Total Assessment is a certain percentage of the fair market value that is determined by local assessors to be the total taxable value of land and additions on the property. | Land | Improvement |
|---|---|---|---|---|
| 2025 | $7,082 | $252,840 | $89,810 | $163,030 |
| 2024 | $6,662 | $252,840 | $89,810 | $163,030 |
| 2023 | $6,291 | $252,840 | $89,810 | $163,030 |
| 2022 | $6,028 | $252,840 | $89,810 | $163,030 |
| 2021 | $5,209 | $182,700 | $85,750 | $96,950 |
| 2020 | $5,169 | $182,280 | $85,750 | $96,530 |
| 2019 | $5,138 | $182,280 | $85,750 | $96,530 |
| 2018 | $4,985 | $182,280 | $85,750 | $96,530 |
| 2017 | $4,768 | $182,280 | $85,750 | $96,530 |
| 2016 | $5,212 | $205,520 | $106,120 | $99,400 |
| 2015 | $5,078 | $205,520 | $106,120 | $99,400 |
| 2014 | $4,939 | $205,520 | $106,120 | $99,400 |
Source: Public Records
Map
Nearby Homes
- 36 Attawan Rd
- 100 Old Black Point Rd
- 150 Black Point Rd
- 127 Black Point Rd Unit 31
- 127 Black Point Rd Unit 7
- 23 Central Ave
- 13 Park Ct
- 71 S Washington Ave
- 61 Terrace Ave
- 42 Nehantic Dr
- 61 Whitecap Rd
- 10 Spencer Ave
- 54 Sea Crest Ave
- 6 Slocum Dr
- 15 Sunnieside Dr
- 19 Sapia Dr
- 12 Spinnaker Dr
- 3 Windward Dr
- 86 Corey Ln
- 15 Griswold Rd
Your Personal Tour Guide
Ask me questions while you tour the home.