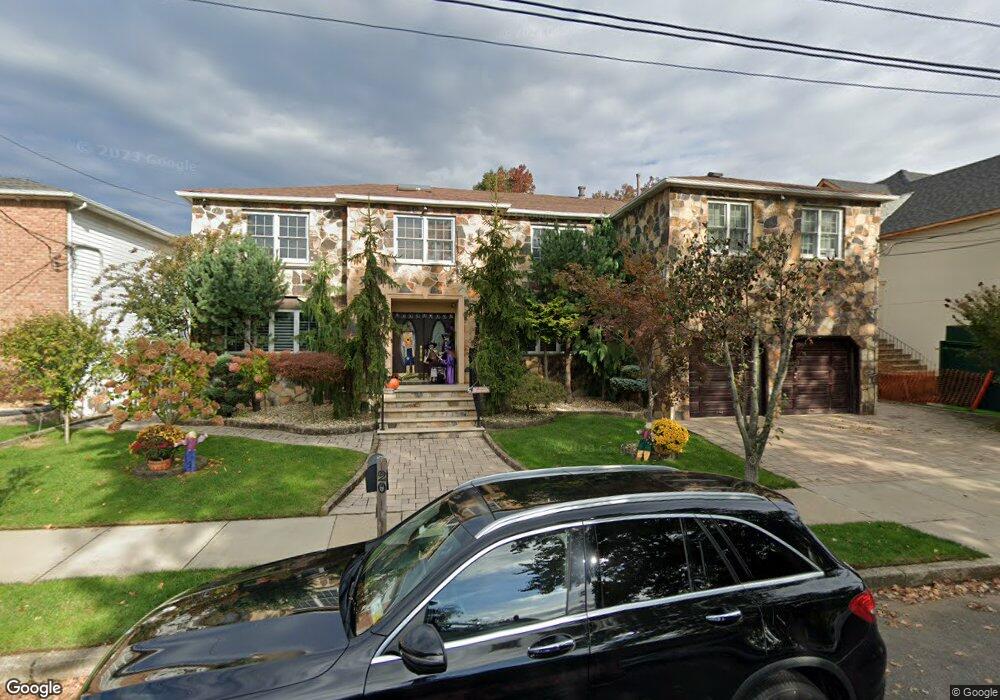
20 Nancy Ln Staten Island, NY 10307
Tottenville NeighborhoodEstimated Value: $1,359,000 - $1,874,000
4
Beds
4
Baths
4,320
Sq Ft
$364/Sq Ft
Est. Value
About This Home
This home is located at 20 Nancy Ln, Staten Island, NY 10307 and is currently estimated at $1,572,569, approximately $364 per square foot. 20 Nancy Ln is a home located in Richmond County with nearby schools including P.S. 6 Cpl Allan F Kivlehan School, Is 34 Tottenville, and Tottenville High School.
Ownership History
Date
Name
Owned For
Owner Type
Purchase Details
Closed on
Nov 5, 2008
Sold by
Bartoletti Leonard R
Bought by
Coladonato Giuseppe and Coladonato Danielle
Current Estimated Value
Home Financials for this Owner
Home Financials are based on the most recent Mortgage that was taken out on this home.
Original Mortgage
$526,500
Outstanding Balance
$344,238
Interest Rate
6%
Mortgage Type
Purchase Money Mortgage
Estimated Equity
$1,228,331
Create a Home Valuation Report for This Property
The Home Valuation Report is an in-depth analysis detailing your home's value as well as a comparison with similar homes in the area
Home Values in the Area
Average Home Value in this Area
Purchase History
| Date | Buyer | Sale Price | Title Company |
|---|---|---|---|
| Coladonato Giuseppe | $810,000 | First Amer Title Ins Co Ny |
Source: Public Records
Mortgage History
| Date | Status | Borrower | Loan Amount |
|---|---|---|---|
| Open | Coladonato Giuseppe | $526,500 |
Source: Public Records
Tax History
| Year | Tax Paid | Tax Assessment Tax Assessment Total Assessment is a certain percentage of the fair market value that is determined by local assessors to be the total taxable value of land and additions on the property. | Land | Improvement |
|---|---|---|---|---|
| 2025 | $15,927 | $87,960 | $20,927 | $67,033 |
| 2024 | $15,927 | $93,900 | $18,494 | $75,406 |
| 2023 | $15,193 | $74,808 | $18,909 | $55,899 |
| 2022 | $14,934 | $84,420 | $21,900 | $62,520 |
| 2021 | $14,925 | $70,920 | $21,900 | $49,020 |
| 2020 | $14,826 | $78,360 | $21,900 | $56,460 |
| 2019 | $13,823 | $71,040 | $21,900 | $49,140 |
| 2018 | $12,708 | $62,340 | $21,900 | $40,440 |
| 2017 | $13,374 | $65,607 | $20,951 | $44,656 |
| 2016 | $12,373 | $61,894 | $20,352 | $41,542 |
| 2015 | $10,791 | $58,392 | $15,920 | $42,472 |
| 2014 | $10,791 | $56,232 | $18,089 | $38,143 |
Source: Public Records
Map
Nearby Homes
Your Personal Tour Guide
Ask me questions while you tour the home.