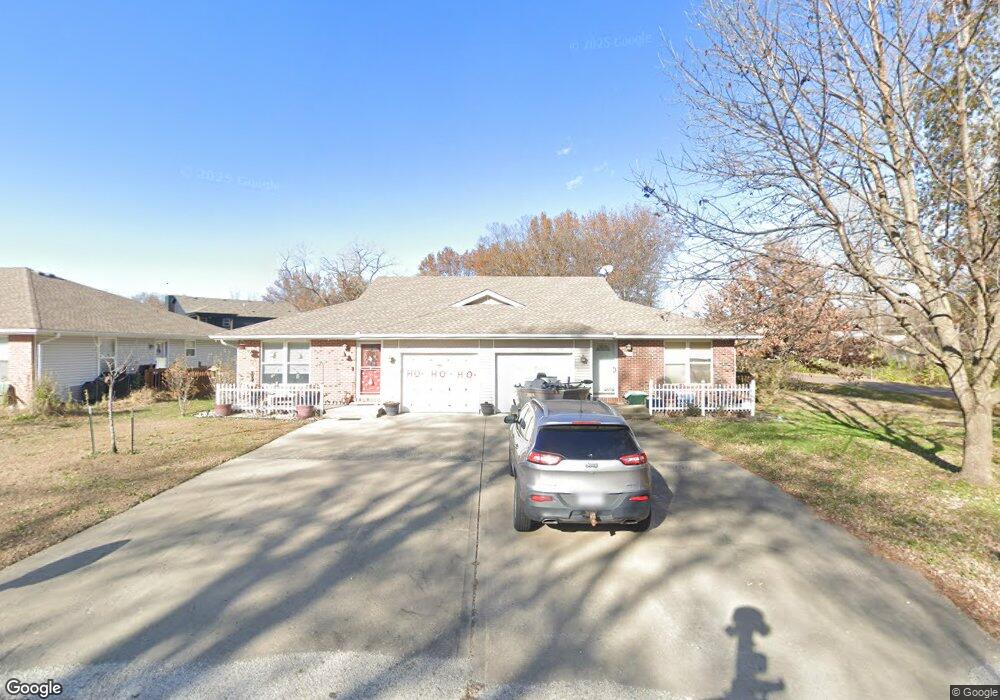
20 Red Bud Ln Trimble, MO 64492
Estimated Value: $182,000 - $236,000
2
Beds
2
Baths
1,065
Sq Ft
$200/Sq Ft
Est. Value
About This Home
This home is located at 20 Red Bud Ln, Trimble, MO 64492 and is currently estimated at $213,453, approximately $200 per square foot. 20 Red Bud Ln is a home located in Clinton County with nearby schools including Ellis Elementary School, Clinton County R-III Middle School, and Plattsburg High School.
Ownership History
Date
Name
Owned For
Owner Type
Purchase Details
Closed on
May 1, 2010
Bought by
Lowe Gregg A
Current Estimated Value
Create a Home Valuation Report for This Property
The Home Valuation Report is an in-depth analysis detailing your home's value as well as a comparison with similar homes in the area
Purchase History
| Date | Buyer | Sale Price | Title Company |
|---|---|---|---|
| Lowe Gregg A | -- | -- |
Source: Public Records
Tax History
| Year | Tax Paid | Tax Assessment Tax Assessment Total Assessment is a certain percentage of the fair market value that is determined by local assessors to be the total taxable value of land and additions on the property. | Land | Improvement |
|---|---|---|---|---|
| 2025 | $1,623 | $23,702 | $1,404 | $22,298 |
| 2024 | $1,623 | $21,163 | $1,254 | $19,909 |
| 2023 | $1,489 | $21,163 | $1,254 | $19,909 |
| 2022 | $1,370 | $19,353 | $1,254 | $18,099 |
| 2021 | $1,358 | $19,353 | $1,254 | $18,099 |
| 2020 | $1,246 | $17,594 | $1,140 | $16,454 |
| 2019 | $1,241 | $17,594 | $1,140 | $16,454 |
| 2018 | $1,239 | $17,594 | $1,140 | $16,454 |
| 2017 | $1,235 | $17,594 | $1,140 | $16,454 |
| 2016 | $1,259 | $17,594 | $1,140 | $16,454 |
| 2013 | -- | $17,590 | $0 | $0 |
Source: Public Records
Map
Nearby Homes
- 10A Highway 169
- 501 Port Arthur Rd
- 7364 SW Crystal Ln
- 7385 SW Karen Rd
- 6009 SW Walnut Cove
- 6320 NE 164th St
- Lot 2 Z Hwy
- Lot 1, 2 Z Hwy
- Z Highway Lot: 1 Unit 2
- 8894 Ssr-Z Hwy
- 8894 SW Highway Z
- 1405 NE 196th Ct
- Lot 3 Z Hwy
- 901 NE 194th Terrace
- 104 Lake Meadows Dr
- 202 Lake Meadows Dr
- 206 Lake Meadows Dr
- 204 Lake Meadows Dr
- 100 Lake Meadows Dr
- 102 Lake Meadows Dr
- 18 Red Bud Ln
- 16 Red Bud Ln
- 16 Redbud Ln
- 14 Red Bud Ln
- 508 Port Arthur Rd
- 12 Red Bud Ln
- 10 Red Bud Ln
- 601 Port Arthur Rd
- 601-643 Port Arthur Rd
- 509 N Main St
- 506 Port Arthur Rd
- 603 Port Arthur Rd
- 2 Red Bud Ln
- 507 N Main St
- 4 Redbud Ln
- 514 N Main St
- 504 Port Arthur Rd
- 610 Port Arthur Rd
- 611 Port Arthur Rd
- 512 N Main St
Your Personal Tour Guide
Ask me questions while you tour the home.