20 Riley St Pawtucket, RI 02861
Darlington NeighborhoodEstimated Value: $375,000 - $413,000
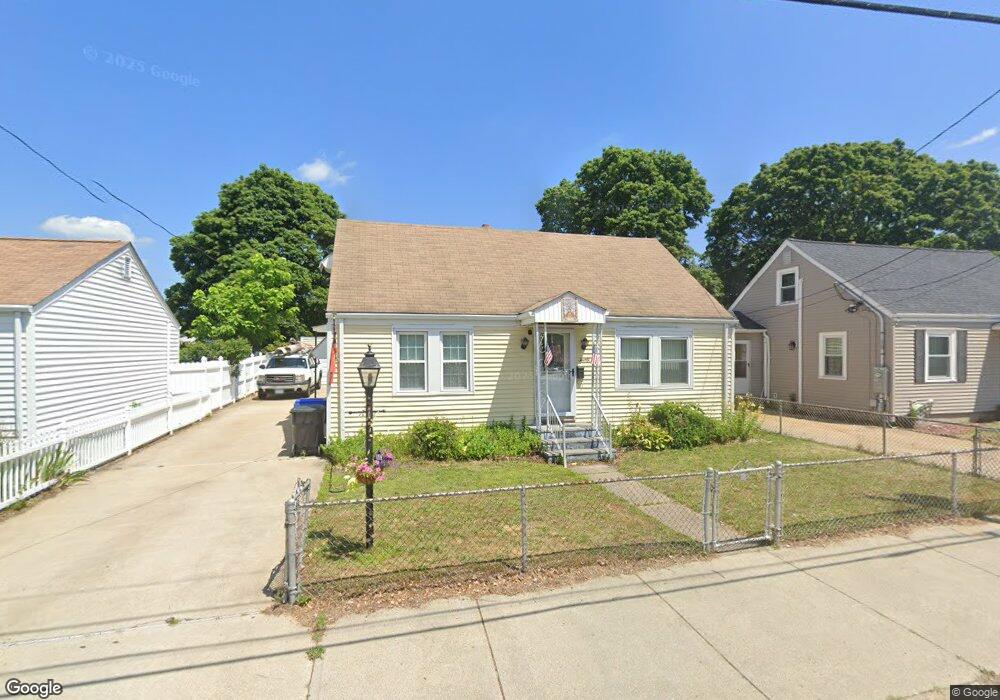
About This Home
This home is located at 20 Riley St, Pawtucket, RI 02861 and is currently estimated at $398,932, approximately $371 per square foot. 20 Riley St is a home located in Providence County with nearby schools including St Cecilia School.
Ownership History
We collect this data history from publicly available records. To have your information removed, we recommend requesting removal directly through your county’s website.
Purchase Details
Home Financials for this Owner
Home Financials are based on the most recent Mortgage that was taken out on this home.Home Values in the Area
Average Home Value in this Area
Purchase History
We collect this data history from publicly available records. To have your information removed, we recommend requesting removal directly through your county’s website.
| Date | Buyer | Sale Price | Title Company |
|---|---|---|---|
| $184,000 | -- |
Mortgage History
We collect this data history from publicly available records. To have your information removed, we recommend requesting removal directly through your county’s website.
| Date | Status | Borrower | Loan Amount |
|---|---|---|---|
| Open | $188,500 | ||
| Closed | $182,000 | ||
| Closed | $171,000 | ||
| Closed | $144,000 |
Tax History
We collect this data history from publicly available records. To have your information removed, we recommend requesting removal directly through your county’s website.
| Year | Tax Paid | Tax Assessment Tax Assessment Total Assessment is a certain percentage of the fair market value that is determined by local assessors to be the total taxable value of land and additions on the property. | Land | Improvement |
|---|---|---|---|---|
| 2025 | $3,881 | $295,100 | $123,500 | $171,600 |
| 2024 | $3,642 | $295,100 | $123,500 | $171,600 |
| 2023 | $3,761 | $222,000 | $77,300 | $144,700 |
| 2022 | $3,681 | $222,000 | $77,300 | $144,700 |
| 2021 | $3,681 | $222,000 | $77,300 | $144,700 |
| 2020 | $3,499 | $167,500 | $61,000 | $106,500 |
| 2019 | $3,499 | $167,500 | $61,000 | $106,500 |
| 2018 | $3,372 | $167,500 | $61,000 | $106,500 |
| 2017 | $3,269 | $143,900 | $50,100 | $93,800 |
| 2016 | $3,150 | $143,900 | $50,100 | $93,800 |
| 2015 | $3,150 | $143,900 | $50,100 | $93,800 |
| 2014 | $3,090 | $134,000 | $50,100 | $83,900 |
Map
- 179 Columbine Ave
- 362 Kenyon Ave
- 377 Kenyon Ave
- 0 Lodi St
- 104 Bates St
- 72 Julian St
- 136 Collins St
- 13 Cameron St
- 25 Mowry St
- 82 Webster St
- 39 Chaplin St
- 46 Slade St
- 147 Tweed St
- 56 Baltic St Unit 56
- 19 Charpentier Ave
- 83 Chaplin St
- 548 Kenyon Ave Unit 42
- 39 Webster St Unit 101
- 27 Collins Ave
- 50 Mavis St Unit 1
Ask me questions while you tour the home.