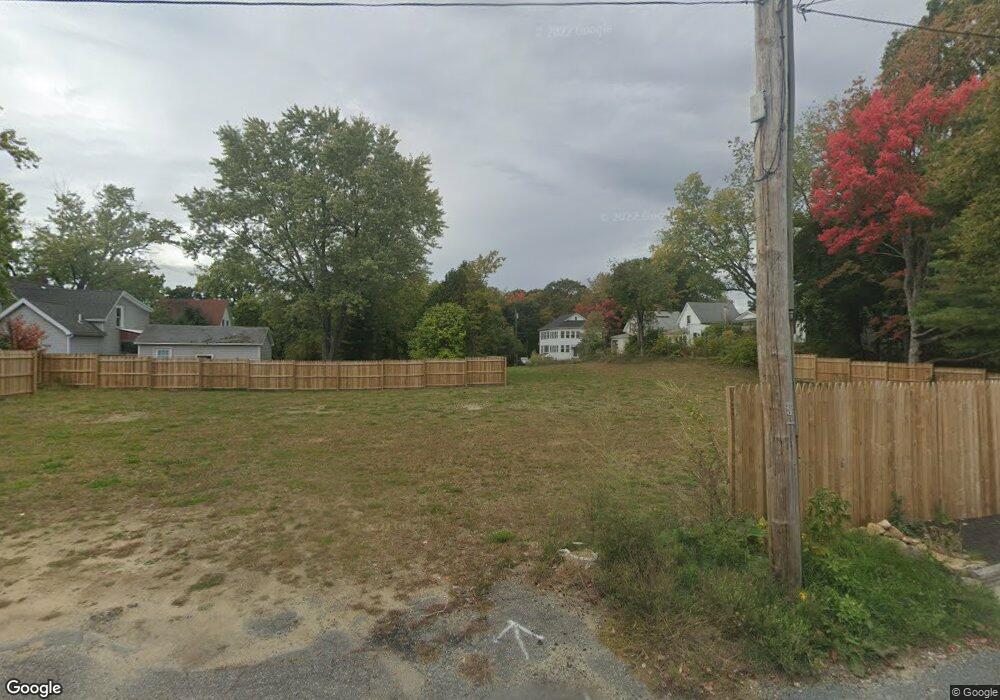
20 Rock St Gardner, MA 01440
Estimated Value: $289,000 - $323,623
Studio
--
Bath
--
Sq Ft
0.56
Acres Lot
About This Home
This home is located at 20 Rock St, Gardner, MA 01440 and is currently estimated at $306,312. 20 Rock St is a home located in Worcester County with nearby schools including Gardner High School and Holy Family Academy.
Ownership History
Date
Name
Owned For
Owner Type
Purchase Details
Closed on
Jul 17, 2024
Sold by
Chartier Christof
Bought by
Rosado Betzaida
Current Estimated Value
Home Financials for this Owner
Home Financials are based on the most recent Mortgage that was taken out on this home.
Original Mortgage
$259,920
Outstanding Balance
$255,302
Interest Rate
6.87%
Mortgage Type
Purchase Money Mortgage
Estimated Equity
$51,010
Purchase Details
Closed on
Jun 23, 2022
Sold by
Gardner City Of
Bought by
Chartier Christopher
Purchase Details
Closed on
Dec 30, 2009
Sold by
Fwl Ind and Joyal
Bought by
Fw Lombard Co
Create a Home Valuation Report for This Property
The Home Valuation Report is an in-depth analysis detailing your home's value as well as a comparison with similar homes in the area
Home Values in the Area
Average Home Value in this Area
Purchase History
We collect this data history from publicly available records. To have your information removed, we recommend requesting removal directly through your county’s website.
| Date | Buyer | Sale Price | Title Company |
|---|---|---|---|
| Rosado Betzaida | $324,900 | None Available | |
| Rosado Betzaida | $324,900 | None Available | |
| Chartier Christopher | $49,200 | None Available | |
| Fw Lombard Co | -- | -- | |
| Fw Lombard Co | -- | -- | |
| Fw Lombard Co | -- | -- |
Source: Public Records
Mortgage History
We collect this data history from publicly available records. To have your information removed, we recommend requesting removal directly through your county’s website.
| Date | Status | Borrower | Loan Amount |
|---|---|---|---|
| Open | Rosado Betzaida | $259,920 | |
| Closed | Rosado Betzaida | $259,920 |
Source: Public Records
Tax History
| Year | Tax Paid | Tax Assessment Tax Assessment Total Assessment is a certain percentage of the fair market value that is determined by local assessors to be the total taxable value of land and additions on the property. | Land | Improvement |
|---|---|---|---|---|
| 2025 | $13 | $90,900 | $90,900 | $0 |
| 2024 | $1,298 | $86,600 | $86,600 | $0 |
| 2023 | $913 | $56,600 | $56,600 | $0 |
| 2022 | $0 | $177,500 | $49,200 | $128,300 |
| 2021 | $2,923 | $170,900 | $49,200 | $121,700 |
| 2020 | -- | $169,300 | $49,200 | $120,100 |
| 2019 | -- | $163,000 | $49,200 | $113,800 |
| 2018 | $2,923 | $157,500 | $49,200 | $108,300 |
| 2017 | $2,923 | $146,800 | $46,700 | $100,100 |
| 2016 | $2,923 | $142,800 | $46,700 | $96,100 |
| 2015 | $2,833 | $141,800 | $46,700 | $95,100 |
| 2014 | $3,944 | $209,000 | $50,700 | $158,300 |
Source: Public Records
Map
Nearby Homes
Your Personal Tour Guide
Ask me questions while you tour the home.