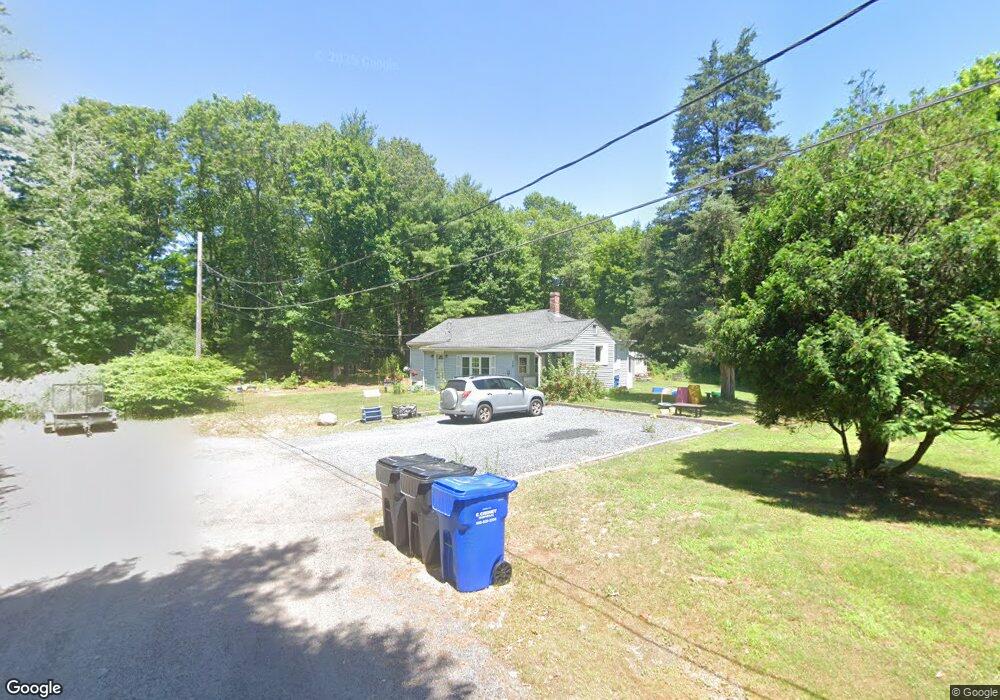
20 Santos Ct Monponsett, MA 02350
Estimated Value: $455,000 - $514,000
3
Beds
1
Bath
1,312
Sq Ft
$371/Sq Ft
Est. Value
About This Home
This home is located at 20 Santos Ct, Monponsett, MA 02350 and is currently estimated at $486,278, approximately $370 per square foot. 20 Santos Ct is a home located in Plymouth County.
Ownership History
Date
Name
Owned For
Owner Type
Purchase Details
Closed on
Jun 17, 2021
Sold by
Tavares Fredrick
Bought by
Tavares Sharonlee
Current Estimated Value
Home Financials for this Owner
Home Financials are based on the most recent Mortgage that was taken out on this home.
Original Mortgage
$308,750
Outstanding Balance
$275,855
Interest Rate
2.9%
Mortgage Type
Purchase Money Mortgage
Estimated Equity
$210,423
Purchase Details
Closed on
Nov 28, 2012
Sold by
Fontes Dominga
Bought by
Tavares Frederick
Home Financials for this Owner
Home Financials are based on the most recent Mortgage that was taken out on this home.
Original Mortgage
$156,455
Interest Rate
3.4%
Mortgage Type
FHA
Create a Home Valuation Report for This Property
The Home Valuation Report is an in-depth analysis detailing your home's value as well as a comparison with similar homes in the area
Home Values in the Area
Average Home Value in this Area
Purchase History
| Date | Buyer | Sale Price | Title Company |
|---|---|---|---|
| Tavares Sharonlee | $325,000 | None Available | |
| Tavares Frederick | -- | -- | |
| Tavares Frederick | $125,600 | -- | |
| Tavares Frederick | $125,600 | -- |
Source: Public Records
Mortgage History
| Date | Status | Borrower | Loan Amount |
|---|---|---|---|
| Open | Tavares Sharonlee | $308,750 | |
| Previous Owner | Tavares Frederick | $156,455 |
Source: Public Records
Tax History
| Year | Tax Paid | Tax Assessment Tax Assessment Total Assessment is a certain percentage of the fair market value that is determined by local assessors to be the total taxable value of land and additions on the property. | Land | Improvement |
|---|---|---|---|---|
| 2025 | $4,996 | $373,400 | $141,500 | $231,900 |
| 2024 | $4,852 | $362,600 | $137,400 | $225,200 |
| 2023 | $4,728 | $333,400 | $137,400 | $196,000 |
| 2022 | $4,574 | $303,100 | $124,900 | $178,200 |
| 2021 | $3,550 | $235,100 | $120,100 | $115,000 |
| 2020 | $3,504 | $229,500 | $116,000 | $113,500 |
| 2019 | $3,297 | $212,300 | $106,800 | $105,500 |
| 2018 | $3,264 | $206,200 | $102,700 | $103,500 |
| 2017 | $3,068 | $192,000 | $91,400 | $100,600 |
| 2016 | $3,136 | $189,500 | $91,400 | $98,100 |
| 2015 | $2,987 | $187,600 | $91,400 | $96,200 |
Source: Public Records
Map
Nearby Homes
- 115 Waltham St
- 0 Union Park St
- 102 Leon Ct
- 22 Ocean Ave
- 15 Ocean Ave
- 0 Thompson St
- 143 Plymouth St
- 553 Monponsett St
- 534 Twin Lakes Dr
- 561 Twin Lakes Dr
- 25 Lawrence Rd
- 37 Annawon Dr
- 102 Twin Lakes Dr
- 10 Mattakeesett Ave
- 51 Oletree Rd
- 290 School St
- 8 10th Ave
- 343 Monponsett St
- 11 Carol Ave
- 1054 Main St
Your Personal Tour Guide
Ask me questions while you tour the home.