20 Spring Ct Woburn, MA 01801
Downtown Woburn NeighborhoodEstimated Value: $623,000 - $685,882
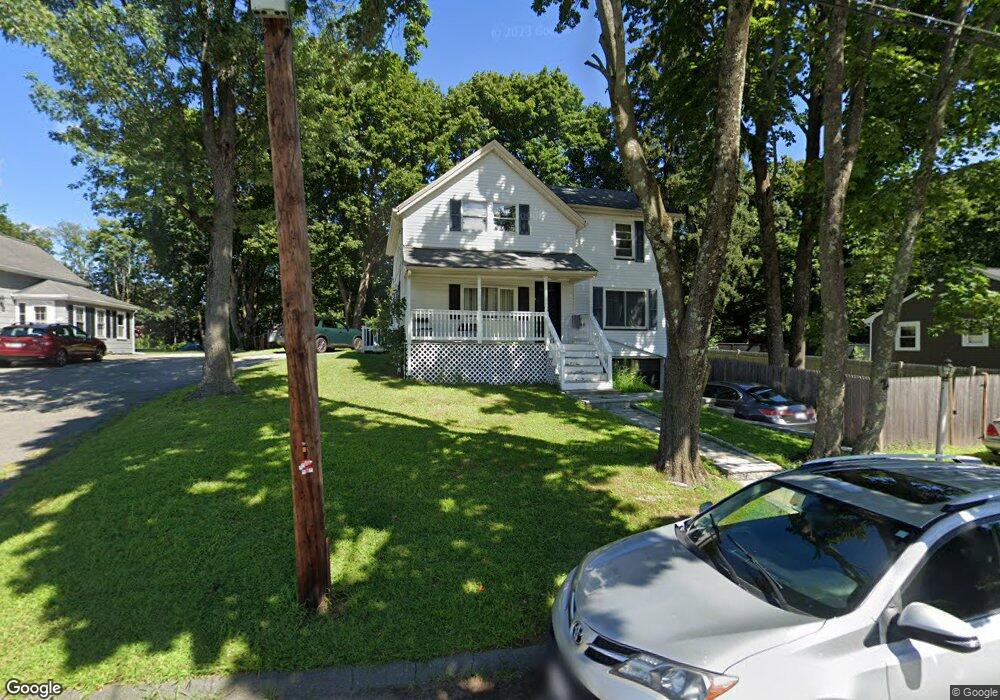
About This Home
This home is located at 20 Spring Ct, Woburn, MA 01801 and is currently estimated at $644,971, approximately $451 per square foot. 20 Spring Ct is a home located in Middlesex County with nearby schools including Shamrock Elementary School, Daniel L. Joyce Middle School, and Woburn High School.
Ownership History
We collect this data history from publicly available records. To have your information removed, we recommend requesting removal directly through your county’s website.
Purchase Details
Home Values in the Area
Average Home Value in this Area
Purchase History
We collect this data history from publicly available records. To have your information removed, we recommend requesting removal directly through your county’s website.
| Date | Buyer | Sale Price | Title Company |
|---|---|---|---|
| $123,600 | -- |
Mortgage History
We collect this data history from publicly available records. To have your information removed, we recommend requesting removal directly through your county’s website.
| Date | Status | Borrower | Loan Amount |
|---|---|---|---|
| Open | $33,000 | ||
| Open | $268,768 | ||
| Closed | $35,000 | ||
| Closed | $233,999 |
Tax History
We collect this data history from publicly available records. To have your information removed, we recommend requesting removal directly through your county’s website.
| Year | Tax Paid | Tax Assessment Tax Assessment Total Assessment is a certain percentage of the fair market value that is determined by local assessors to be the total taxable value of land and additions on the property. | Land | Improvement |
|---|---|---|---|---|
| 2025 | $4,588 | $537,200 | $272,600 | $264,600 |
| 2024 | $4,082 | $506,400 | $259,600 | $246,800 |
| 2023 | $4,107 | $472,100 | $236,000 | $236,100 |
| 2022 | $3,943 | $422,200 | $205,200 | $217,000 |
| 2021 | $3,627 | $388,700 | $195,500 | $193,200 |
| 2020 | $3,612 | $387,500 | $195,500 | $192,000 |
| 2019 | $3,534 | $372,000 | $186,100 | $185,900 |
| 2018 | $3,303 | $334,000 | $170,800 | $163,200 |
| 2017 | $3,133 | $315,200 | $162,700 | $152,500 |
| 2016 | $2,988 | $297,300 | $152,000 | $145,300 |
| 2015 | $2,875 | $282,700 | $142,100 | $140,600 |
| 2014 | $2,802 | $268,400 | $142,100 | $126,300 |
Map
- 9 James Terrace
- 4 Laurel St
- 11 Skyview Ln
- 64 Garfield Ave
- 31 Eastern Ave
- 8 Woods Hill Cir
- 164 Green St
- 219 Montvale Ae
- 65 High St Unit 1
- 42 Wood St
- 33 Montvale Ave Unit 11
- 201 Main St Unit 21
- 7 Prospect St
- 11 Williams Cir
- 477 Main St
- 3 Conn St Unit 3
- 257 Cross St
- 109 Main St Unit 1
- 6 Richmond Park
- 258 Cross St
Ask me questions while you tour the home.