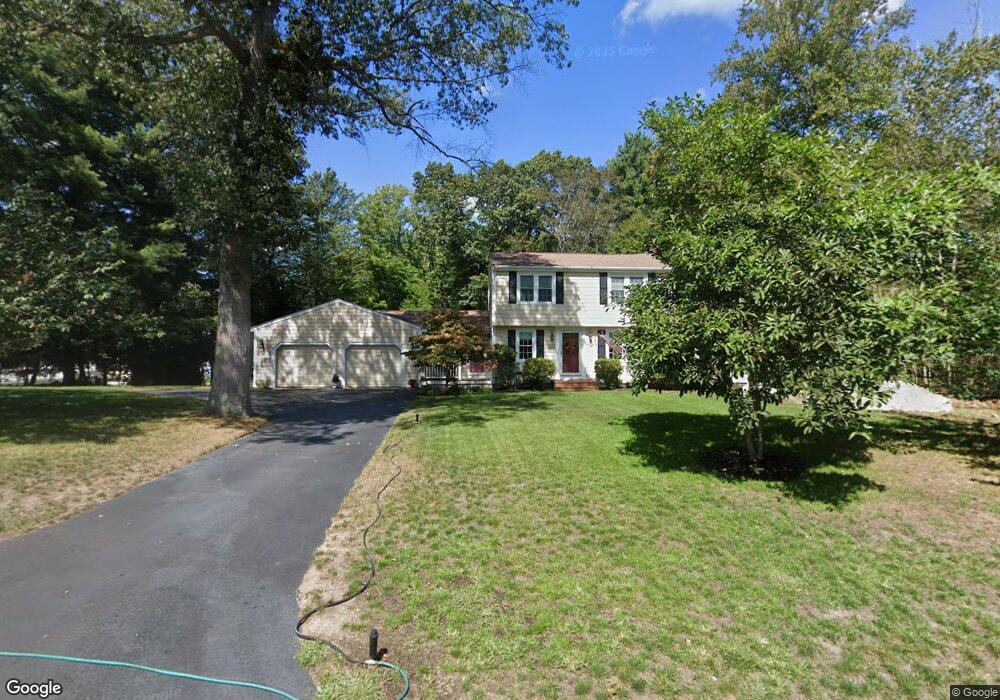
20 Vine St Hanover, MA 02339
Estimated Value: $808,543 - $853,000
About This Home
This home is located at 20 Vine St, Hanover, MA 02339 and is currently estimated at $831,636, approximately $466 per square foot. 20 Vine St is a home located in Plymouth County with nearby schools including Hanover High School, Calvary Chapel Academy, and Holy Family Elementary School.
Ownership History
We collect this data history from publicly available records. To have your information removed, we recommend requesting removal directly through your county’s website.
Purchase Details
Home Values in the Area
Average Home Value in this Area
Purchase History
We collect this data history from publicly available records. To have your information removed, we recommend requesting removal directly through your county’s website.
| Date | Buyer | Sale Price | Title Company |
|---|---|---|---|
| $349,900 | -- |
Mortgage History
We collect this data history from publicly available records. To have your information removed, we recommend requesting removal directly through your county’s website.
| Date | Status | Borrower | Loan Amount |
|---|---|---|---|
| Open | $300,000 | ||
| Closed | $50,000 | ||
| Closed | $185,000 |
Tax History
We collect this data history from publicly available records. To have your information removed, we recommend requesting removal directly through your county’s website.
| Year | Tax Paid | Tax Assessment Tax Assessment Total Assessment is a certain percentage of the fair market value that is determined by local assessors to be the total taxable value of land and additions on the property. | Land | Improvement |
|---|---|---|---|---|
| 2025 | $8,654 | $700,700 | $269,600 | $431,100 |
| 2024 | $8,465 | $659,300 | $269,600 | $389,700 |
| 2023 | $7,942 | $588,700 | $245,100 | $343,600 |
| 2022 | $8,374 | $549,100 | $245,100 | $304,000 |
| 2021 | $8,219 | $503,300 | $222,800 | $280,500 |
| 2020 | $7,803 | $478,400 | $222,800 | $255,600 |
| 2019 | $7,580 | $461,900 | $222,800 | $239,100 |
| 2018 | $7,137 | $438,400 | $222,800 | $215,600 |
| 2017 | $6,947 | $420,500 | $210,000 | $210,500 |
| 2016 | $6,690 | $396,800 | $191,000 | $205,800 |
| 2015 | $6,408 | $396,800 | $191,000 | $205,800 |
Map
- 491 Webster St
- 70 Holly Berry Ln
- 142 Marks St
- 375 Webster St
- 42 Bard Rock Ln
- 13 Midfield Dr Unit 13
- 313 E Water St
- 15 Midfield Dr Unit 15
- 92-94 Stanton St
- 659 Liberty St
- 25 Buffum Rd
- 173 Liberty St
- 27 Stanton St
- 49 Custer St
- 196 Myrtle St
- 31 Delprete Ave
- 48 Bigelow Ave
- 14 Sugar Maple Cir Unit 14
- 107 E Water St
- 471 Union St
- 48 Maple Ave
- 55 Dwelley Ave
- 67 Dwelley Ave
- 56 Dwelley Ave
- 68 Dwelley Ave
- 64 Vine St
- 52 Vine St
- 44 Dwelley Ave
- 99 Dwelley Ave
- LOT 3 Tiffany Mill Ln
- LOT 1 Buttercup Ln
- LOT 38 Plain St
- LT 100 Meeting Hill Rd
- 82 Dwelley Ave
- 72 Vine St
- 34 Dwelley Ave
- 19 Vine St
- 115 Dwelley Ave
- 21 Dwelley Ave
- 90 Dwelley Ave
Ask me questions while you tour the home.