Estimated Value: $228,659 - $257,000
3
Beds
2
Baths
1,144
Sq Ft
$211/Sq Ft
Est. Value
About This Home
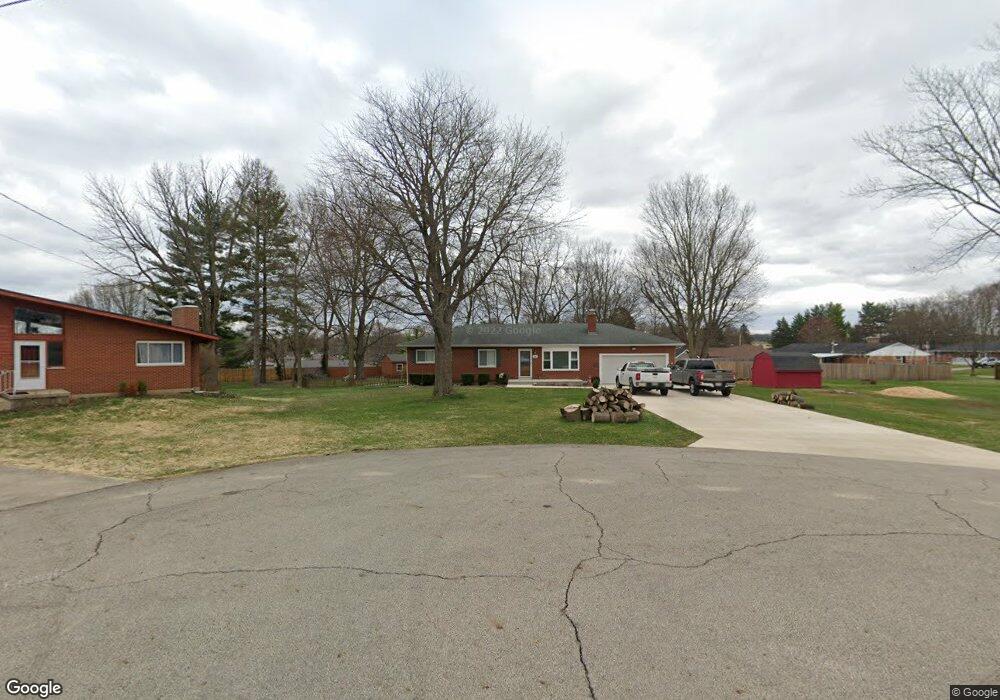
This home is located at 200 Doric Cir, Enon, OH 45323 and is currently estimated at $241,415, approximately $211 per square foot. 200 Doric Cir is a home located in Clark County with nearby schools including Greenon Elementary School, Greenon Jr. High School, and Greenon High School.
Ownership History
Date
Name
Owned For
Owner Type
Purchase Details
Closed on
Oct 9, 1997
Sold by
Beck Charles W
Bought by
Belcher Michael H and Belcher Nancy
Current Estimated Value
Home Financials for this Owner
Home Financials are based on the most recent Mortgage that was taken out on this home.
Original Mortgage
$111,500
Outstanding Balance
$16,262
Interest Rate
7.7%
Mortgage Type
VA
Estimated Equity
$225,153
Purchase Details
Closed on
Sep 1, 1981
Create a Home Valuation Report for This Property
The Home Valuation Report is an in-depth analysis detailing your home's value as well as a comparison with similar homes in the area
Home Values in the Area
Average Home Value in this Area
Purchase History
| Date | Buyer | Sale Price | Title Company |
|---|---|---|---|
| Belcher Michael H | $114,000 | -- | |
| -- | -- | -- |
Source: Public Records
Mortgage History
| Date | Status | Borrower | Loan Amount |
|---|---|---|---|
| Open | Belcher Michael H | $111,500 |
Source: Public Records
Tax History
| Year | Tax Paid | Tax Assessment Tax Assessment Total Assessment is a certain percentage of the fair market value that is determined by local assessors to be the total taxable value of land and additions on the property. | Land | Improvement |
|---|---|---|---|---|
| 2025 | $2,777 | $65,310 | $14,340 | $50,970 |
| 2024 | $2,788 | $48,520 | $11,760 | $36,760 |
| 2023 | $2,788 | $48,520 | $11,760 | $36,760 |
| 2022 | $2,786 | $48,520 | $11,760 | $36,760 |
| 2021 | $2,610 | $39,980 | $8,400 | $31,580 |
| 2020 | $2,616 | $39,980 | $8,400 | $31,580 |
| 2019 | $2,648 | $39,980 | $8,400 | $31,580 |
| 2018 | $2,642 | $38,660 | $8,400 | $30,260 |
| 2017 | $2,647 | $30,342 | $8,397 | $21,945 |
| 2016 | $2,277 | $30,342 | $8,397 | $21,945 |
| 2015 | $2,051 | $30,342 | $8,397 | $21,945 |
| 2014 | $2,055 | $30,342 | $8,397 | $21,945 |
| 2013 | $1,886 | $30,342 | $8,397 | $21,945 |
Source: Public Records
Map
Nearby Homes
- 3924 Schenley St
- 4024 Raymond Dr
- 46-48 W Main St
- 100 Green Valley Dr
- 303 E Main St
- 141 N Xenia Dr
- 144 Matthews Ave
- 2133 Willow Run Cir Unit 2133
- 2151 Willow Run Cir Unit 2151
- 1010 Meadow Lark Dr
- 7050 Creekside Cir
- 5463 Enon-Xenia Rd
- 4600 Snider Rd
- 0 Enon-Xenia Rd
- 6250 Fairfield Pike
- 199 Fairfield Pike
- 6 Danzig Ln
- 5055 Hahn Ave
- 0 Enon Xenia Rd
- 5221 Ottawa Dr
- 300 Doric Cir
- 325 Coronado Trail
- 333 Coronado Trail
- 91 Grand Valley Dr
- 111 Grand Valley Dr
- 81 Grand Valley Dr
- 315 Coronado Trail
- 341 Coronado Trail
- 600 Doric Cir
- 307 Coronado Trail
- 340 Coronado Trail
- 332 Coronado Trail
- 345 Coronado Trail
- 348 Coronado Trail
- 324 Coronado Trail
- 90 Grand Valley Dr
- 356 Coronado Trail
- 110 Grand Valley Dr
- 308 Coronado Trail
- 324 S Xenia Dr
Your Personal Tour Guide
Ask me questions while you tour the home.