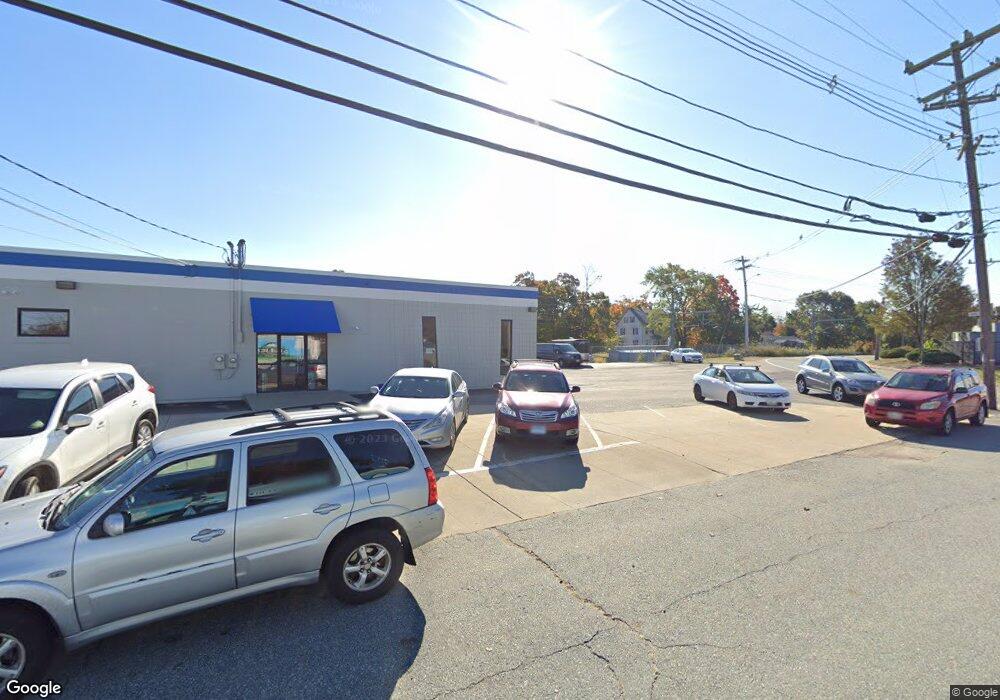
200 Lavan St Warwick, RI 02888
Warwick City Center NeighborhoodEstimated Value: $769,070
Studio
--
Bath
5,200
Sq Ft
$148/Sq Ft
Est. Value
About This Home
This home is located at 200 Lavan St, Warwick, RI 02888 and is currently estimated at $769,070, approximately $147 per square foot. 200 Lavan St is a home located in Kent County with nearby schools including Nel/Cps Construction Career, Immaculate Conception Catholic Regional School, and Cadence Academy Preschool - Cranston.
Ownership History
Date
Name
Owned For
Owner Type
Purchase Details
Closed on
Jan 31, 2013
Sold by
Link Commericil Props
Bought by
Amd Holdings Llc
Current Estimated Value
Home Financials for this Owner
Home Financials are based on the most recent Mortgage that was taken out on this home.
Original Mortgage
$255,000
Outstanding Balance
$177,006
Interest Rate
3.41%
Mortgage Type
Commercial
Estimated Equity
$592,064
Purchase Details
Closed on
Jun 22, 2010
Sold by
Broad Street Prop
Bought by
Link Commercial Prop
Purchase Details
Closed on
May 12, 2010
Sold by
Washington Trust Co
Bought by
Rozzero Rlty
Purchase Details
Closed on
Nov 15, 2006
Sold by
Spl Assoc
Bought by
Rozzero Rt
Home Financials for this Owner
Home Financials are based on the most recent Mortgage that was taken out on this home.
Original Mortgage
$750,000
Interest Rate
6.33%
Mortgage Type
Commercial
Create a Home Valuation Report for This Property
The Home Valuation Report is an in-depth analysis detailing your home's value as well as a comparison with similar homes in the area
Home Values in the Area
Average Home Value in this Area
Purchase History
| Date | Buyer | Sale Price | Title Company |
|---|---|---|---|
| Amd Holdings Llc | $300,000 | -- | |
| Link Commercial Prop | $230,000 | -- | |
| Rozzero Rlty | $216,000 | -- | |
| Rozzero Rt | $450,000 | -- |
Source: Public Records
Mortgage History
| Date | Status | Borrower | Loan Amount |
|---|---|---|---|
| Open | Rozzero Rt | $255,000 | |
| Previous Owner | Rozzero Rt | $500,000 | |
| Previous Owner | Rozzero Rt | $750,000 |
Source: Public Records
Tax History
| Year | Tax Paid | Tax Assessment Tax Assessment Total Assessment is a certain percentage of the fair market value that is determined by local assessors to be the total taxable value of land and additions on the property. | Land | Improvement |
|---|---|---|---|---|
| 2025 | $8,816 | $367,500 | $129,100 | $238,400 |
| 2024 | $8,746 | $345,400 | $112,000 | $233,400 |
| 2023 | $8,576 | $345,400 | $112,000 | $233,400 |
| 2022 | $8,711 | $310,000 | $93,400 | $216,600 |
| 2021 | $8,711 | $310,000 | $93,400 | $216,600 |
| 2020 | $8,711 | $310,000 | $93,400 | $216,600 |
| 2019 | $8,711 | $310,000 | $93,400 | $216,600 |
| 2018 | $9,725 | $311,800 | $116,700 | $195,100 |
| 2017 | $9,466 | $311,800 | $116,700 | $195,100 |
| 2016 | $9,466 | $311,800 | $116,700 | $195,100 |
| 2015 | $9,351 | $300,400 | $119,900 | $180,500 |
| 2014 | $9,039 | $300,400 | $119,900 | $180,500 |
| 2013 | $8,916 | $300,400 | $119,900 | $180,500 |
Source: Public Records
Map
Nearby Homes
Your Personal Tour Guide
Ask me questions while you tour the home.