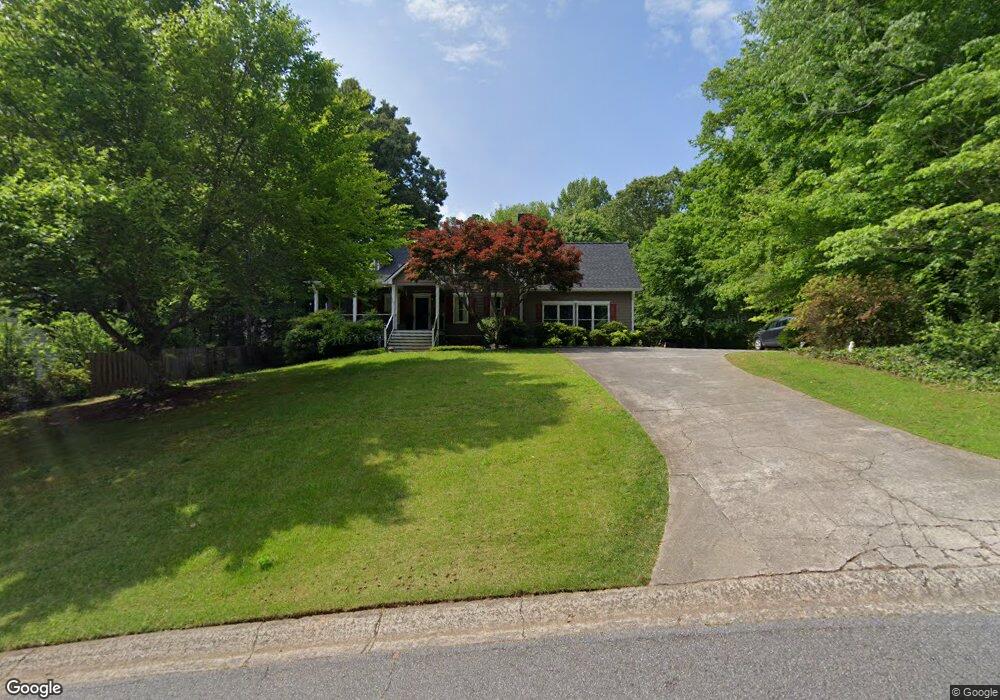
2002 Laurel Cove Ball Ground, GA 30107
Estimated Value: $463,000 - $512,880
4
Beds
5
Baths
4,074
Sq Ft
$120/Sq Ft
Est. Value
About This Home
This home is located at 2002 Laurel Cove, Ball Ground, GA 30107 and is currently estimated at $487,940, approximately $119 per square foot. 2002 Laurel Cove is a home located in Cherokee County with nearby schools including Ball Ground Elementary School, Creekland Middle School, and Creekview High School.
Ownership History
Date
Name
Owned For
Owner Type
Purchase Details
Closed on
Jun 30, 2017
Sold by
Roper Christy
Bought by
Robinson Jeremiah and Robinson Stephanie
Current Estimated Value
Home Financials for this Owner
Home Financials are based on the most recent Mortgage that was taken out on this home.
Original Mortgage
$247,926
Outstanding Balance
$212,347
Interest Rate
5.25%
Mortgage Type
FHA
Estimated Equity
$275,593
Create a Home Valuation Report for This Property
The Home Valuation Report is an in-depth analysis detailing your home's value as well as a comparison with similar homes in the area
Home Values in the Area
Average Home Value in this Area
Purchase History
| Date | Buyer | Sale Price | Title Company |
|---|---|---|---|
| Robinson Jeremiah | $252,500 | -- |
Source: Public Records
Mortgage History
| Date | Status | Borrower | Loan Amount |
|---|---|---|---|
| Open | Robinson Jeremiah | $247,926 |
Source: Public Records
Tax History
| Year | Tax Paid | Tax Assessment Tax Assessment Total Assessment is a certain percentage of the fair market value that is determined by local assessors to be the total taxable value of land and additions on the property. | Land | Improvement |
|---|---|---|---|---|
| 2025 | $4,970 | $199,044 | $32,000 | $167,044 |
| 2024 | $4,748 | $189,096 | $28,000 | $161,096 |
| 2023 | $4,258 | $184,712 | $26,000 | $158,712 |
| 2022 | $3,952 | $146,644 | $26,000 | $120,644 |
| 2021 | $3,891 | $133,580 | $19,200 | $114,380 |
| 2020 | $3,571 | $122,192 | $19,200 | $102,992 |
| 2019 | $3,200 | $109,320 | $19,200 | $90,120 |
| 2018 | $2,926 | $99,200 | $19,200 | $80,000 |
| 2017 | $2,619 | $226,100 | $14,400 | $76,040 |
| 2016 | $2,579 | $219,600 | $14,400 | $73,440 |
| 2015 | $1,963 | $195,500 | $11,600 | $66,600 |
| 2014 | $1,865 | $185,700 | $11,600 | $62,680 |
Source: Public Records
Map
Nearby Homes
- 1029 Laurel Lake Dr Unit 1
- 8125 Brewton Bend
- 8135 Brewton Bend
- 8080 Brewton Bend
- 8150 Brewton Bend
- 3040 Cypress Cove
- 2063 Canton Rd
- 114 Nelson Ridge Dr
- 174 Cherokee Ave
- 1712 Pickens St
- 1612 Pickens St
- 153 Church St
- 204 North Ave
- 125 Nelson Oaks Dr
- 123 Nelson Oaks Dr
- 653 Fairview Rd
- 1025 Pickens St
- 239 Fairview Rd
- 1573 Ray Mountain Rd
- 1584 Kennesaw Ave
- 1024 Laurel Lake Dr Unit 1
- 1022 Laurel Lake Dr
- 2006 Laurel Cove
- 2010 Laurel Cove Unit 2A
- 1026 Laurel Lake Dr
- 2003 Laurel Cove
- 1025 Laurel Lake Dr Unit 1
- 2007 Laurel Cove Unit 2007
- 2007 Laurel Cove
- 2007 Laurel Cove
- 1016 Laurel Lake Dr
- 1018 Laurel Lake Dr Unit 1
- 1014 Laurel Lake Dr Unit 1
- 2014 Laurel Cove
- 1027 Laurel Lake Dr
- 1028 Laurel Lake Dr
- 2018 Laurel Cove
- 2022 Laurel Cove
- 1021 Laurel Lake Dr
- 1011 Laurel Lake Dr
Your Personal Tour Guide
Ask me questions while you tour the home.