
Seller's Agent in 2026
Mel Padilla
Orchard Brokerage
(214) 288-5799
2 in this area
20 Total Sales
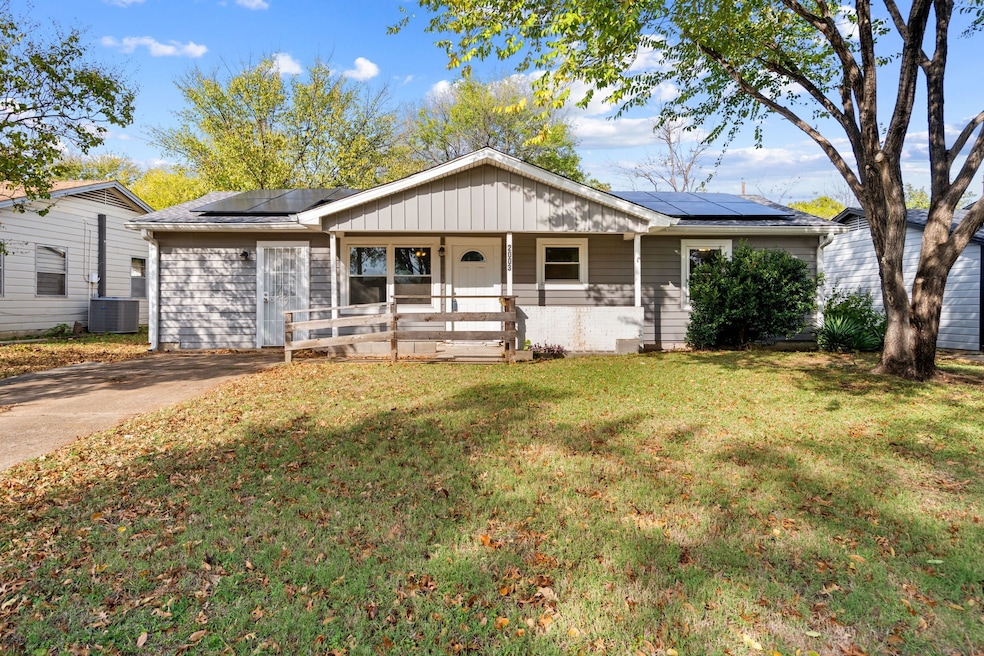


Step into this inviting 3-4 bedroom, 1-bathroom home, thoughtfully updated while preserving its classic 1950s character. Located in the well-established Ridgecrest community and served by Irving ISD, it offers a welcoming blend of charm, comfort, and convenience—an ideal choice for anyone seeking a perfect starter home. Inside, a newly renovated interior creates a fresh, move-in-ready feel. The family room provides a comfortable central gathering space, offering plenty of flexibility for relaxing or entertaining. Each bedroom is well-sized, with natural light adding warmth throughout the home. The updated bathroom complements the home’s refreshed style, making daily living both easy and enjoyable. The kitchen and living areas flow naturally, giving this single-level layout a smooth, practical design suited to modern routines. Out back, a generous yard offers endless potential—room for play, gardening, outdoor dining, including a workshop & storage shed. It’s an inviting extension of the indoor living space, perfect for creating your own outdoor retreat. The home comes with Solar Panels a $30k added value that convey with the property. To active just let your preferred electric company know. Nestled in the heart of Irving, this home places you minutes from local shopping, dining, entertainment, and everyday conveniences. Its central location and community feel make it an exceptional opportunity for those seeking classic charm paired with smart updates in a prime location. Cute, comfortable, and full of character, this Ridgecrest gem is ready to welcome its next owners.
Last Agent to Sell the Property
Orchard Brokerage Brokerage Phone: 214-288-5799 License #0695778 Listed on: 12/03/2025
Last Buyer's Agent
Maria Gonzalez
6th Ave Homes License #0679695
We collect this data history from publicly available records. To have your information removed, we recommend requesting removal directly through your county’s website.
| Date | Type | Sale Price | Title Company |
|---|---|---|---|
| Deed | -- | Orchard Title | |
| Interfamily Deed Transfer | -- | None Available | |
| Warranty Deed | -- | Rt | |
| Warranty Deed | -- | -- | |
| Warranty Deed | -- | -- |
We collect this data history from publicly available records. To have your information removed, we recommend requesting removal directly through your county’s website.
| Date | Status | Loan Amount | Loan Type |
|---|---|---|---|
| Open | $255,290 | FHA | |
| Previous Owner | $117,119 | Fannie Mae Freddie Mac | |
| Previous Owner | $59,670 | FHA |
| Date | Event | Price | List to Sale | Price per Sq Ft |
|---|---|---|---|---|
| 03/16/2026 03/16/26 | Sold | -- | -- | -- |
| 02/24/2026 02/24/26 | Pending | -- | -- | -- |
| 02/13/2026 02/13/26 | Price Changed | $264,900 | -1.9% | $202 / Sq Ft |
| 01/15/2026 01/15/26 | Price Changed | $269,900 | -1.9% | $206 / Sq Ft |
| 01/03/2026 01/03/26 | For Sale | $275,000 | 0.0% | $210 / Sq Ft |
| 12/27/2025 12/27/25 | Pending | -- | -- | -- |
| 12/03/2025 12/03/25 | For Sale | $275,000 | -- | $210 / Sq Ft |
| Year | Tax Paid | Tax Assessment Tax Assessment Total Assessment is a certain percentage of the fair market value that is determined by local assessors to be the total taxable value of land and additions on the property. | Land | Improvement |
|---|---|---|---|---|
| 2025 | $873 | $260,850 | $50,000 | $210,850 |
| 2024 | $873 | $259,390 | $50,000 | $209,390 |
| 2023 | $873 | $209,430 | $50,000 | $159,430 |
| 2022 | $4,830 | $209,430 | $50,000 | $159,430 |
| 2021 | $4,005 | $165,610 | $40,000 | $125,610 |
| 2020 | $4,155 | $165,610 | $40,000 | $125,610 |
| 2019 | $3,939 | $148,540 | $35,000 | $113,540 |
| 2018 | $3,984 | $148,540 | $35,000 | $113,540 |
| 2017 | $2,930 | $108,750 | $25,000 | $83,750 |
| 2016 | $2,670 | $99,120 | $25,000 | $74,120 |
| 2015 | $1,017 | $87,270 | $22,000 | $65,270 |
| 2014 | $1,017 | $80,390 | $20,000 | $60,390 |
Seller's Agent in 2026
Mel Padilla
Orchard Brokerage
(214) 288-5799
2 in this area
20 Total Sales
M
Buyer's Agent in 2026
Maria Gonzalez
6th Ave Homes
Source: North Texas Real Estate Information Systems (NTREIS)
MLS Number: 21122711
APN: 32432500240080000
Disclaimer: Certain information contained herein is derived from information provided by parties other than Homes.com. All information provided is deemed reliable, but is not guaranteed to be accurate and should be independently verified.
![]() Listing information provided in part by the North Texas Real Estate Information Systems, Inc, for personal, non-commercial use by viewers of this site and may not be reproduced or redistributed. All information is deemed reliable but not guaranteed. Copyright © NTREIS 2026. All rights reserved
Listing information provided in part by the North Texas Real Estate Information Systems, Inc, for personal, non-commercial use by viewers of this site and may not be reproduced or redistributed. All information is deemed reliable but not guaranteed. Copyright © NTREIS 2026. All rights reserved
Ask me questions while you tour the home.