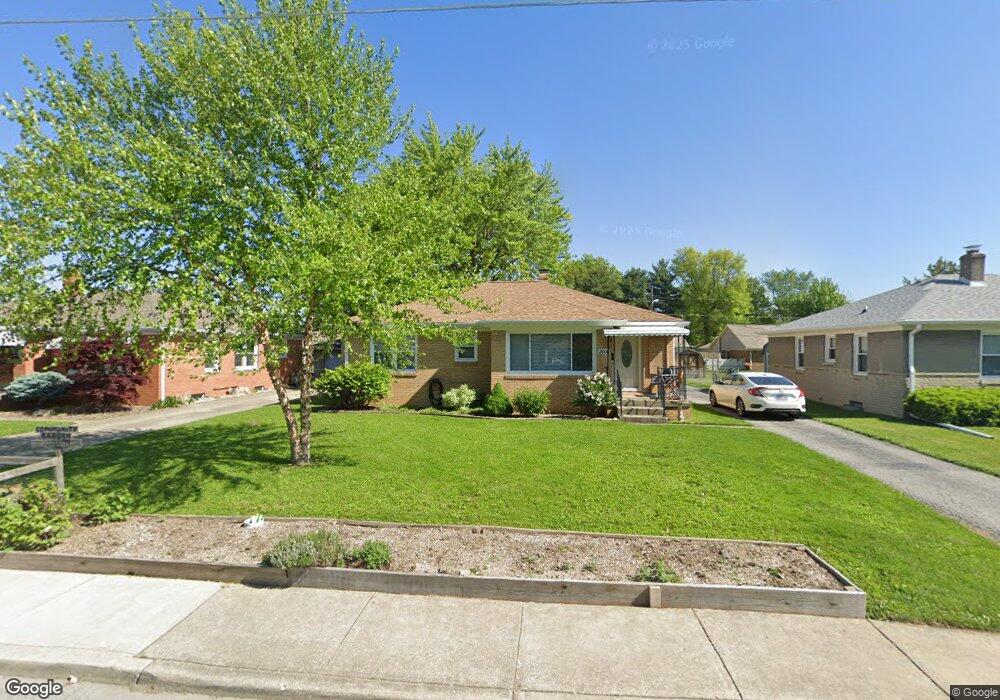
2006 Main St Beech Grove, IN 46107
Estimated Value: $213,424 - $229,000
3
Beds
2
Baths
1,228
Sq Ft
$178/Sq Ft
Est. Value
About This Home
This home is located at 2006 Main St, Beech Grove, IN 46107 and is currently estimated at $219,106, approximately $178 per square foot. 2006 Main St is a home located in Marion County with nearby schools including Hornet Park Elementary School, Central Elementary School, and South Grove Intermediate School.
Ownership History
Date
Name
Owned For
Owner Type
Purchase Details
Closed on
Nov 25, 2013
Sold by
Sedinger Sandra and Sedinger James T
Bought by
Deak Anthony A
Current Estimated Value
Home Financials for this Owner
Home Financials are based on the most recent Mortgage that was taken out on this home.
Original Mortgage
$78,320
Outstanding Balance
$57,674
Interest Rate
4.3%
Mortgage Type
New Conventional
Estimated Equity
$161,432
Purchase Details
Closed on
Oct 31, 2013
Sold by
Sedinger Sandra
Bought by
Deak Anthony A
Home Financials for this Owner
Home Financials are based on the most recent Mortgage that was taken out on this home.
Original Mortgage
$78,320
Outstanding Balance
$57,674
Interest Rate
4.3%
Mortgage Type
New Conventional
Estimated Equity
$161,432
Purchase Details
Closed on
Sep 2, 2010
Sold by
Turk Nancy
Bought by
Sedinger James Terrance and Sedinger Sandra
Home Financials for this Owner
Home Financials are based on the most recent Mortgage that was taken out on this home.
Original Mortgage
$64,136
Interest Rate
4.36%
Mortgage Type
FHA
Purchase Details
Closed on
Sep 18, 2009
Sold by
Turk Nancy and Sedinger Leah Lavera
Bought by
Turk Nancy and Leah Lavera Sedinger Revocable Trust
Create a Home Valuation Report for This Property
The Home Valuation Report is an in-depth analysis detailing your home's value as well as a comparison with similar homes in the area
Home Values in the Area
Average Home Value in this Area
Purchase History
| Date | Buyer | Sale Price | Title Company |
|---|---|---|---|
| Deak Anthony A | -- | -- | |
| Deak Anthony A | $97,900 | -- | |
| Sedinger James Terrance | -- | None Available | |
| Turk Nancy | -- | None Available |
Source: Public Records
Mortgage History
| Date | Status | Borrower | Loan Amount |
|---|---|---|---|
| Open | Deak Anthony A | $78,320 | |
| Previous Owner | Sedinger James Terrance | $64,136 |
Source: Public Records
Tax History
| Year | Tax Paid | Tax Assessment Tax Assessment Total Assessment is a certain percentage of the fair market value that is determined by local assessors to be the total taxable value of land and additions on the property. | Land | Improvement |
|---|---|---|---|---|
| 2025 | $2,356 | $199,500 | $9,500 | $190,000 |
| 2024 | $2,356 | $175,400 | $9,500 | $165,900 |
| 2023 | $2,134 | $159,800 | $9,500 | $150,300 |
| 2022 | $2,068 | $150,000 | $9,500 | $140,500 |
| 2021 | $1,596 | $122,500 | $9,500 | $113,000 |
| 2020 | $1,329 | $109,000 | $9,500 | $99,500 |
| 2019 | $1,185 | $100,900 | $9,100 | $91,800 |
| 2018 | $1,067 | $93,900 | $9,100 | $84,800 |
| 2017 | $1,101 | $94,700 | $9,100 | $85,600 |
| 2016 | $992 | $87,000 | $9,100 | $77,900 |
| 2014 | $967 | $87,400 | $9,100 | $78,300 |
| 2013 | $807 | $89,000 | $9,100 | $79,900 |
Source: Public Records
Map
Nearby Homes
- 1901 Main St
- 2021 Ticen Ct
- 39 N 18th Ave
- 1611 Main St
- 2118 Newcomer Ln
- 2215 Albany St
- 225 Clark Ave
- 1526 Main St
- 69 N 16th Ave
- 298 Clark Ave
- 2214 Mann Dr
- 306 N 18th Ave
- 304 Cleveland St
- 2832 S Oakland Ave
- 3106 E Sumner Ave
- 415 N 18th Ave
- 3011 Cameron St
- 1005 Main St
- 2021 Prospect St
- 1639 E Southern Ave
Your Personal Tour Guide
Ask me questions while you tour the home.